Microsoft SQL monitoring integration
Our Microsoft SQL Server integration collects and sends metric and inventory data from your Microsoft SQL Server environment to our platform so you can monitor the health of your Microsoft SQL Server environment. We collect both database and instance-level metrics so you can troubleshoot and resolve performance problems.

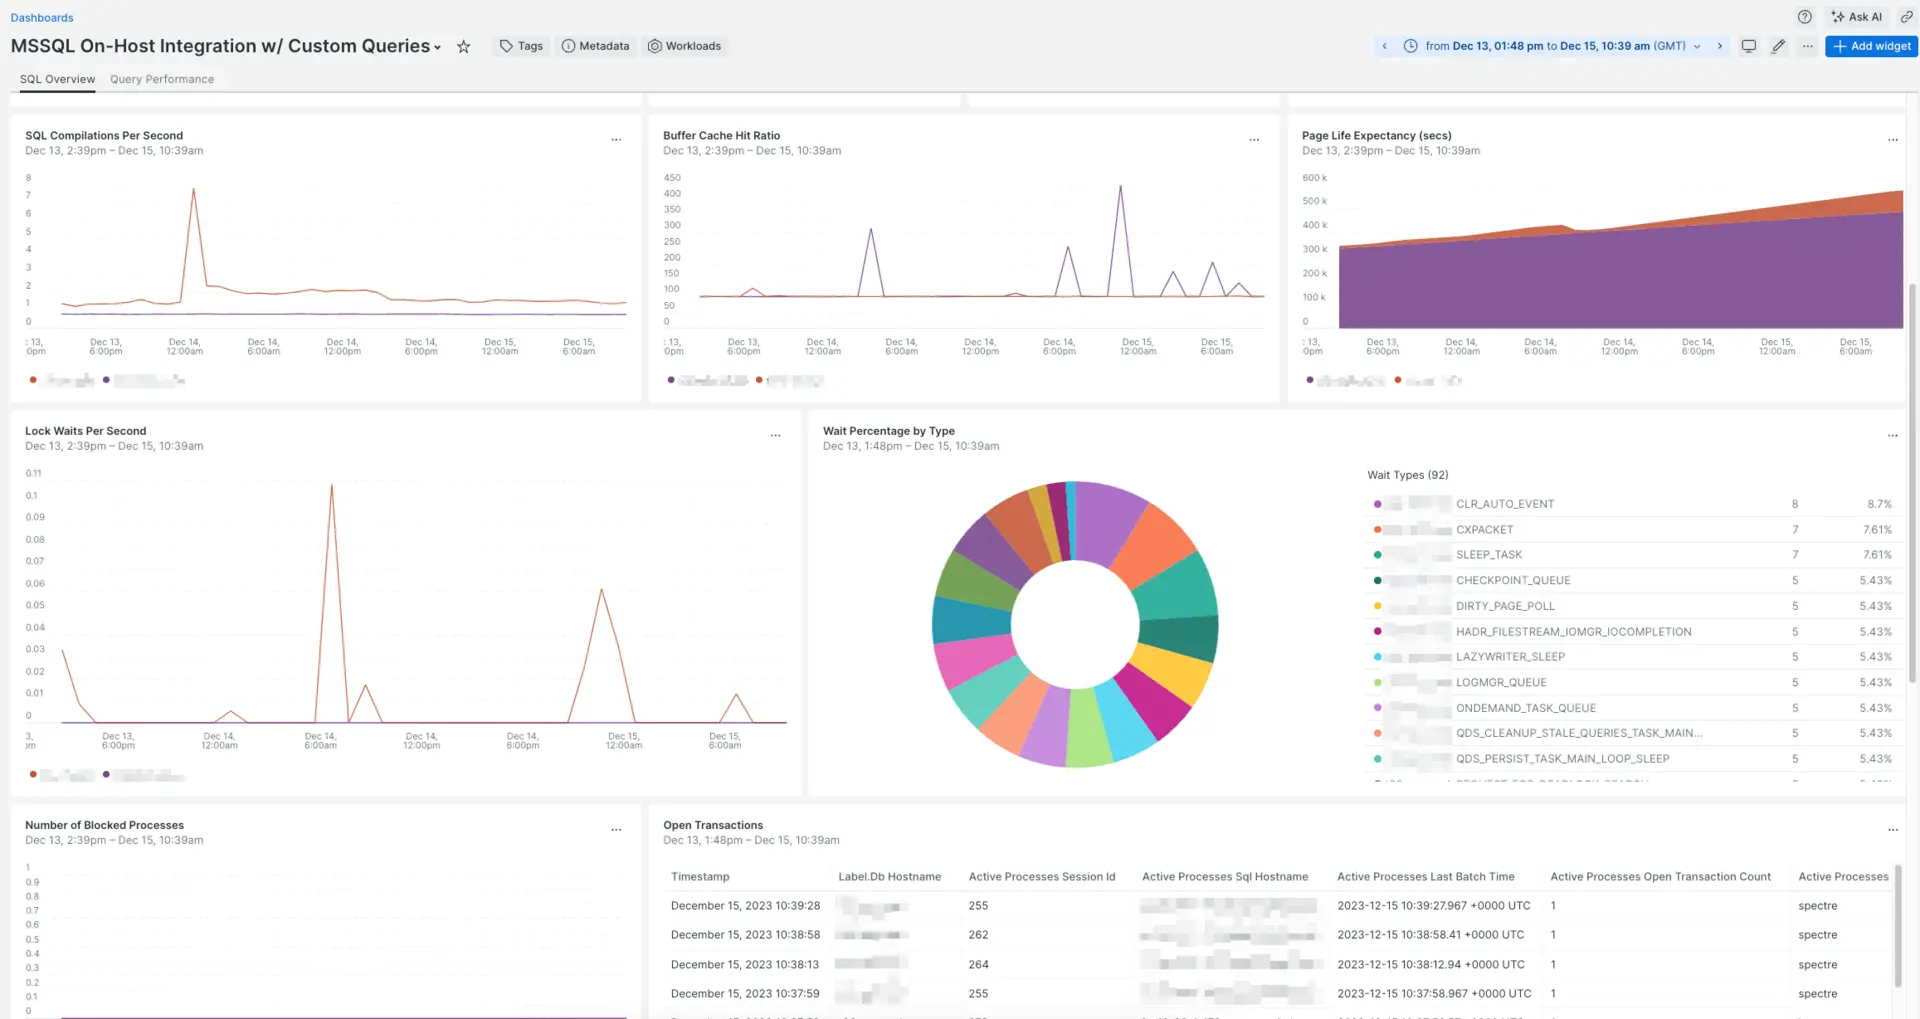
Dashboard installed through the New Relic Microsoft SQL Server monitoring integration.
Sample configuration files
Metrics collected by the integration
The Microsoft SQL Server integration collects the following metric data attributes. Some metric name are prefixed with a category indicator and a period, such as asserts. or flush..
Microsoft SQL Server instance settings
The Microsoft SQL Server integration collects both Metrics and Inventory information. In the table, use the Applies to column for the settings available to each collection:
Setting | Description | Default | Applies to |
|---|---|---|---|
| Hostname or IP where MS SQL server is running. |
| M/I |
| Port on which MS SQL server is listening.
|
| M/I |
| The MS SQL Server Instance to connect to.
| N/A | M/I |
| Username for accessing the MS SQL server.
| N/A | M/I |
| Password for the given SQL or Domain user. | N/A | M/I |
| Specify extra connection parameters as attr1=val1&attr2=val2. | N/A | M/I |
| Use SSL to connect to the MS SQL Server. |
| M/I |
| if set to |
| M/I |
| Location of the SSL Certificate. | N/A | M/I |
| Timeout for queries, in seconds. Set |
| M/I |
| Enable collection of buffer pool metrics. These can be resource intensive for large systems. |
| M |
| Enable collection of database partition reserve space. These can be resource intensive for large systems. |
| M |
| Enable collection of the volume stats for each MSSQL instance. |
| M |
| A SQL query to collect custom metrics. See the custom query example. | N/A | M |
| YAML configuration with one or more SQL queries to collect custom metrics. See the multiple custom queries example. |
| M |
| Set to |
| |
| Set to |
|
The values for these settings can be defined in several ways:
Adding the value directly in the config file. This is the most common way.
Replacing the values from environment variables using the
{{ }}notation. Read more about using environment variable passthroughs with on-host integrations or see the example for environment variables replacement.重要
This requires infrastructure agent v1.14.0+.Using secrets management. Use this to protect sensitive information, such as passwords that would be exposed in plain text on the configuration file. For more information, see secrets management.
Inventory data
The Microsoft SQL Server integration captures the configuration parameters and current settings of the Microsoft SQL Server environment. It collects the results of the sp_configure stored procedure, as well as current running configuration settings from the sys.configurations table. The data is available on the Inventory page, under the config/mssql source.
For more about inventory data, see Understand integration data.