Our Sendmail integration monitors the performance of your Sendmail mail transfer agent, helping you quickly instrument and monitor your agent.

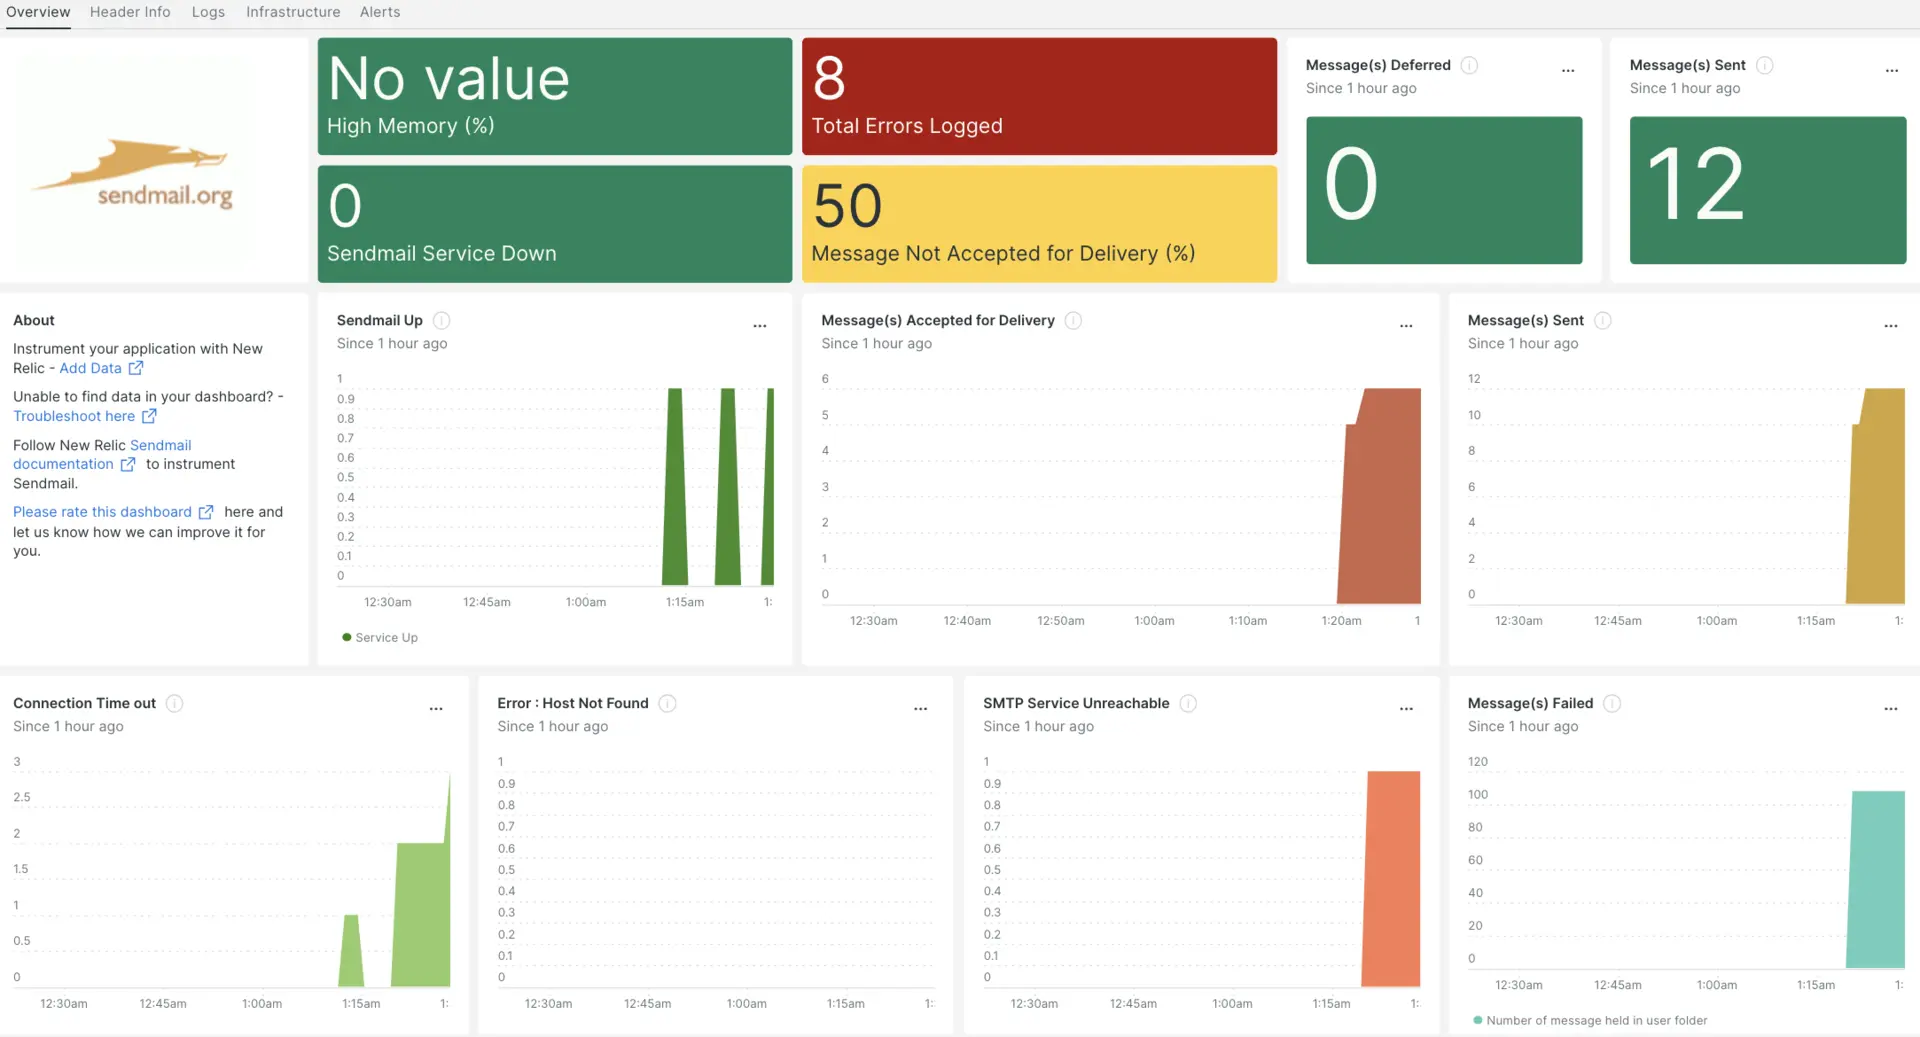
After setting up the integration with New Relic, see your data in dashboards like these, right out of the box.
Complete the following steps to install the integration:
Install the infrastructure agent
To use the Sendmail integration, you need to first install the infrastructure agent on the same host. The infrastructure agent monitors the host itself, while the integration you'll install in the next step extends your monitoring with Sendmail-specific data.
Use NRI-Flex to capture metrics
Flex allows you to capture Apache Zookeeper metrics. It comes bundled with the New Relic infrastructure agent you installed in the previous step.
Create a file named
sendmail-flex-config.ymlin the/newrelic-infra/integrations.dpath.Update the
sendmail-flex-config.ymlwith the following configuration example.Make sure to replace
FAILED_MESSAGES_FILE_NAMEreferences with your file name. To find this file name, go to/var/mail/and check the file that has been created for failed messages.---integrations:- name: nri-flexconfig:name: sendmailFlexapis:#check if Sendmail service is up.- event_type: SendmailUpcommands:- run: echo "value:$(systemctl status sendmail | grep 'Active':' active (running)' | wc -l)"split_by: ':'#check if Sendmail service is down.- event_type: SendmailDowncommands:- run: echo "value:$(systemctl status sendmail | grep 'Active':' inactive (dead)' | wc -l)"split_by: ':'#Read the number of times SMTP service is unreachable.- event_type: SendmailSMTPserviceUnreachablecommands:- run: echo "value:$(cat /var/log/mail.log | grep -E 'stat=Service unavailable' | wc -l)"split_by: ':'#Read the count of error message - host not found.- event_type: SendmailHostNotFoundcommands:- run: echo "value:$(cat /var/log/mail.log | grep -c 'host not found')"split_by: ':'#Read the count of error logged.- event_type: SendmailErrorCountcommands:- run: echo "value:$(cat /var/log/mail.err | wc -l)"split_by: ':'#Read the number of messages accepted for delivery.- event_type: SendmailMessageAcceptedForDeliverycommands:- run: echo "value:$(cat /var/log/mail.log | grep -c 'Message accepted for delivery')"split_by: ':'#Read the number of messages sent & deferred.- event_type: SendmailMessageStatuscommands:- run: echo "sent:$(cat /var/log/mail.log | grep 'stat=Sent' | wc -l)"split_by: ':'- run: echo "deferred:$(cat /var/log/mail.log | grep 'stat=Deferred' | wc -l)"split_by: ':'#Read the number of messages held by user.#Go to the path "/var/mail/" and check the file that has been created for failed messages and accordingly update "FAILED_MESSAGES_FILE_NAME" in the below command.- event_type: SendmailHeldMessagecommands:- run: echo "value:$(cat /var/mail/FAILED_MESSAGES_FILE_NAME | grep -c 'Subject:')"split_by: ':'#Read the number of connection timeout.- event_type: SendmailConnectionTimeOutcommands:- run: echo "value:$(cat /var/log/mail.log | grep -c 'timeout')"split_by: ':'#Read the recipients with message count.- event_type: SendmailRecipientsbyMessageCountcommands:- run: cat /var/log/mail.log | grep "to=<.*.>" | awk '{n=split($7,a,"to="); print a[1],a[2]}' | cut -d "<" -f2 |cut -d ">" -f1 | sort | uniq -c | sort -nrsplit: horizontalheader_split_by: \s+(\d+)\s+(.*.)set_header: [msgCount.total, recipients.total]regex_match: truesplit_by: \s+(\d+)\s+(.*.)- run: cat /var/log/mail.log | grep "to=<.*.>" | grep "$(date +'%b %e')" | awk '{n=split($7,a,"to="); print a[1],a[2]}' | cut -d "<" -f2 |cut -d ">" -f1 | sort | uniq -c | sort -nrsplit: horizontalheader_split_by: \s+(\d+)\s+(.*.)set_header: [msgCount.latest, recipients.latest]regex_match: truesplit_by: \s+(\d+)\s+(.*.)#Read the recipients host/domain.- event_type: SendmailRecipientsHostnamecommands:- run: cat /var/log/mail.log | grep "to=<.*.>" | awk '{print $7}' | grep -oE '[^@]+[a-zA-Z0-9\-\.]+\.[a-zA-Z]{2,}' | sort | uniq -csplit: horizontalheader_split_by: \s+(\d+)\s+(.*.)set_header: [hostCount.total, hostname.total]regex_match: truesplit_by: \s+(\d+)\s+(.*.)- run: cat /var/log/mail.log | grep "to=<.*.>" | grep "$(date +'%b %e')" | awk '{print $7}' | grep -oE '[^@]+[a-zA-Z0-9\-\.]+\.[a-zA-Z]{2,}' | sort | uniq -csplit: horizontalheader_split_by: \s+(\d+)\s+(.*.)set_header: [hostCount.latest, hostname.latest]regex_match: truesplit_by: \s+(\d+)\s+(.*.)#Read the senders with message count.- event_type: SendmailSendersbyMessageCountcommands:- run: cat /var/log/mail.log | grep "from=<.*@.*>" | awk '{print $7}' | cut -d "<" -f2 |cut -d ">" -f1 | sort | uniq -csplit: horizontalheader_split_by: \s+(\d+)\s+(.*.)set_header: [msg.total, senders.total]regex_match: truesplit_by: \s+(\d+)\s+(.*.)- run: cat /var/log/mail.log | grep "from=<.*@.*>" | grep "$(date +'%b %e')" | awk '{print $7}' | cut -d "<" -f2 |cut -d ">" -f1 | sort | uniq -csplit: horizontalheader_split_by: \s+(\d+)\s+(.*.)set_header: [msg.latest, senders.latest]regex_match: truesplit_by: \s+(\d+)\s+(.*.)#Read the senders host/domain.- event_type: SendmailSendersHostnamecommands:- run: cat /var/log/mail.log | grep "from=<.*.>" | awk '{print $7}' | grep -oE '[^@]+[a-zA-Z0-9\-\.]+\.[a-zA-Z]{2,}' | sort | uniq -csplit: horizontalheader_split_by: \s+(\d+)\s+(.*.)set_header: [hostCount.total, hostname.total]regex_match: truesplit_by: \s+(\d+)\s+(.*.)- run: cat /var/log/mail.log | grep "from=<.*.>" | grep "$(date +'%b %e')" | awk '{print $7}' | grep -oE '[^@]+[a-zA-Z0-9\-\.]+\.[a-zA-Z]{2,}' | sort | uniq -csplit: horizontalheader_split_by: \s+(\d+)\s+(.*.)set_header: [hostCount.latest, hostname.latest]regex_match: truesplit_by: \s+(\d+)\s+(.*.)
Forward your Sendmail logs to New Relic
You can use our log forwarding capability to forward Sendmail logs to New Relic.
Add the following script to /etc/newrelic-infra/logging.d/logging.yml:
logs: - name: mail.log file: /var/log/mail.log attributes: logtype: sendmail_log - name: mail.err file: /var/log/mail.err attributes: logtype: sendmail_errorRestart the New Relic infrastructure agent
Before you can start reading your data, use the instructions in our infrastructure agent docs to restart your infrastructure agent.
$sudo systemctl restart newrelic-infra.serviceIn a couple of minutes, your application will send metrics to one.newrelic.com.
Find your data
You can choose our pre-built dashboard template named Sendmail to monitor your Sendmail application metrics. Follow these steps to use our pre-built dashboard template:
From one.newrelic.com, go to the + Integrations & Agents page.
Click on Dashboards.
In the search bar, type
sendmail.The Sendmail dashboard should appear. Click on it to install it.
Your Sendmail dashboard is considered a custom dashboard and can be found in the Dashboards UI. For docs on using and editing dashboards, see our dashboard docs.
Here is a NRQL query to find your latest message's sent status:
SELECT latest(sent) AS 'Sent', latest(deferred) AS 'Deferred'FROM SendmailMessageStatusHere is a NRQL query to find view the Sendmail service status:
SELECT latest(value) AS 'Service Up'FROM SendmailUpTIMESERIES AUTO
What's next?
To learn more about building NRQL queries and generating dashboards, check out these docs:
- Introduction to the query builder to create basic and advanced queries.
- Introduction to dashboards to customize your dashboard and carry out different actions.
- Manage your dashboard to adjust your display mode, or to add more content to your dashboard.