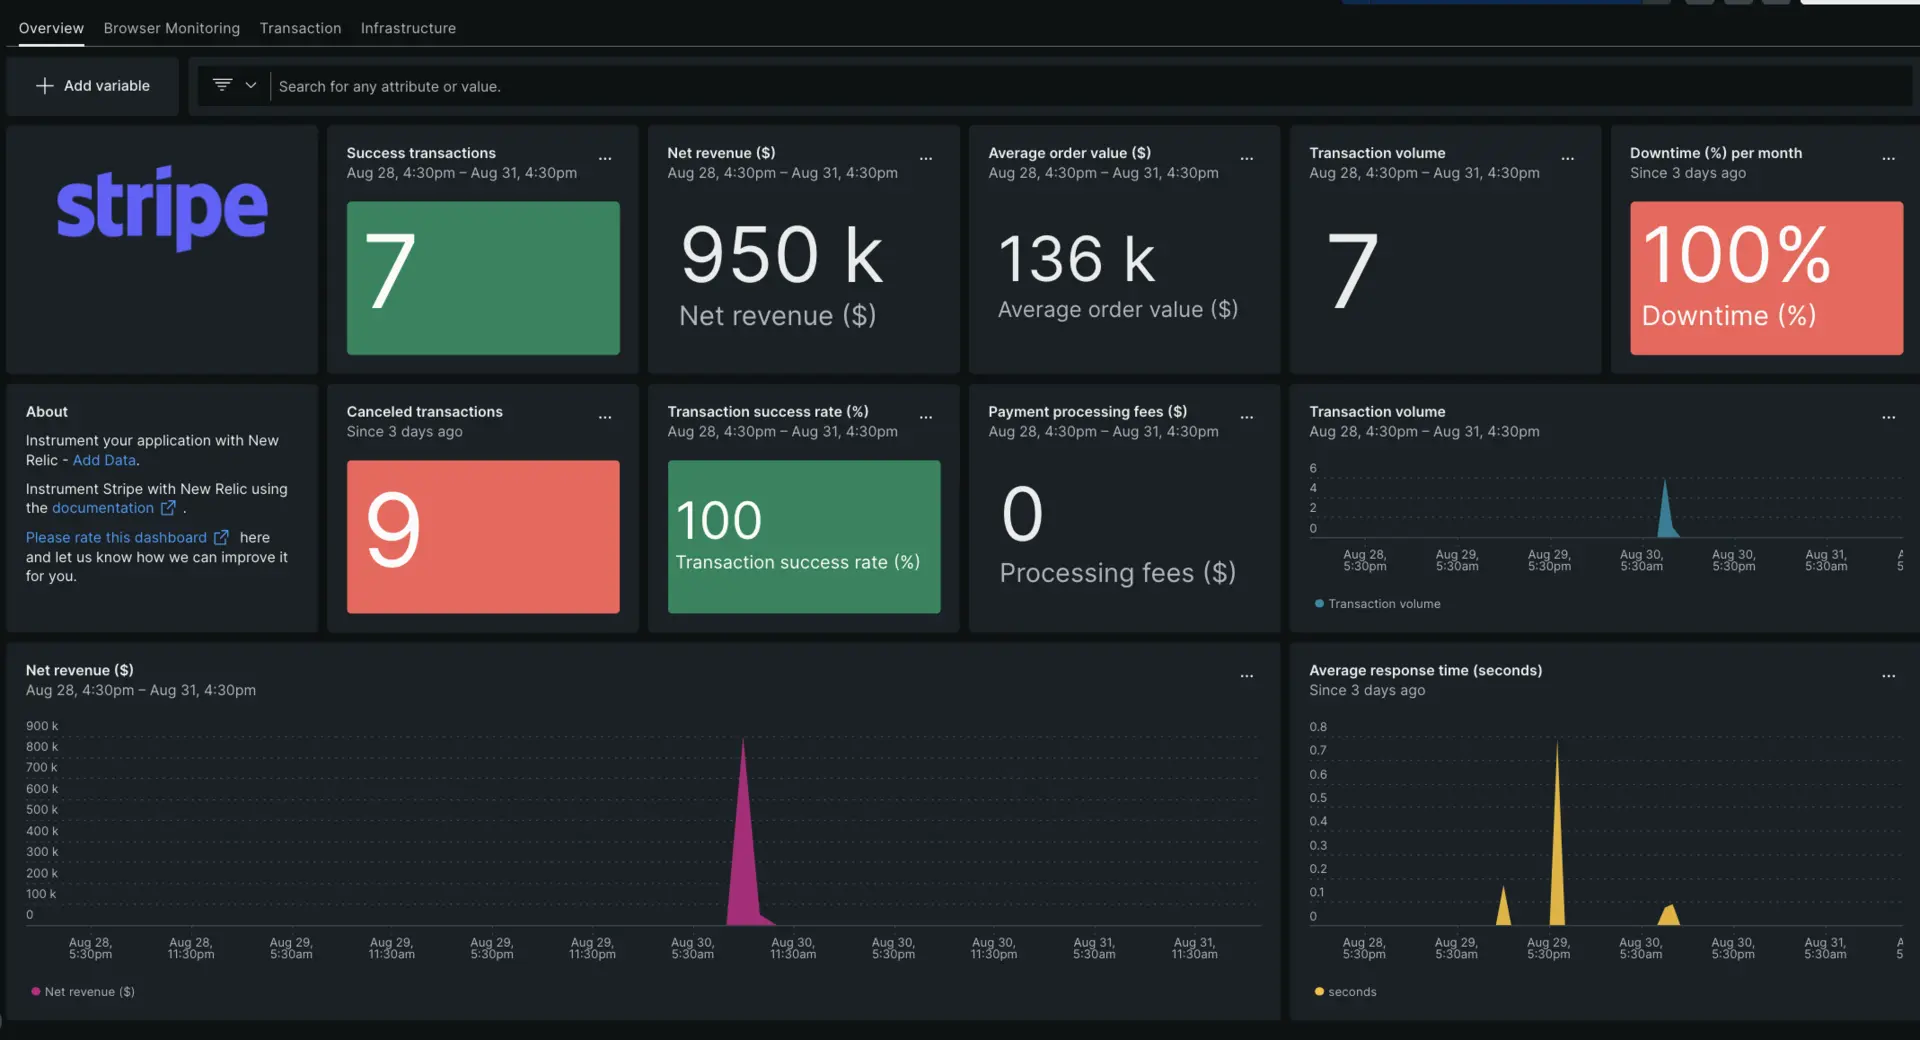
To monitor your Stripe application, you'll instrument the application so it sends data to the New Relic Metric API. Then, you can view the data in a single, pre-built Stripe dashboard that tracks metrics like transaction overview, transaction volume, revenue, and transaction errors.

View all your Stripe app's metrics in one dashboard.
Set up Stripe monitoring
To set up Stripe monitoring, you'll create a call from your Stripe application to the New Relic Metrics API. The way you do this will vary, depending on the language and agent you're using. Here's an example of how to create this API call using JavaScript.
Tip
For more guidance about using this API, see the Metric API documentation.
Before you get started, make sure you have a New Relic license key (See New Relic API Keys).
On a successful Stripe payment, we receive a JSON from the Stripe API service. We need to send these values to New Relic by formatting the JSON according to the New Relic Metric API requirements.
The following JavaScript code snippet formats the data and sends it to the New Relic Metric API URL.
const sendDataToNewRelic = (sessionJSON) => { const currentDate = new Date(); const currentTime = currentDate.getTime(); const nrMetrics = [{ "metrics": [ { "name": "stripe_metrics", "timestamp": currentTime, "value": 0, "attributes": { "stripe.session_id": sessionJSON.id, "stripe.amount_total": sessionJSON.amount_total, "stripe.customer_email": sessionJSON.customer_details.email, "stripe.created_at": sessionJSON.created, "stripe.currency" : sessionJSON.currency, "stripe.payment_status": sessionJSON.payment_status, "stripe.status": sessionJSON.status, "stripe.discount_amount":sessionJSON.total_details.amount_discount, "stripe.shipping_amount":sessionJSON.total_details.amount_shipping, "stripe.tax_amount":sessionJSON.total_details.amount_tax } } ] }]
const nrMetricAPI = 'https://metric-api.newrelic.com/metric/v1' axios({ url: nrMetricAPI, method: 'POST', headers: { 'Content-Type': 'application/x-www-form-urlencoded', 'Api-Key': 'LICENSE_KEY' }, data: JSON.stringify(nrMetrics) }) .then((response) => { // Handle the response here if needed console.log('Metrics data sent successfully:', response.data); }) .catch((error) => { // Handle any errors that occur during the request console.error('Error sending metrics data to New Relic:', error); })}Be sure to change the sessionJSON according to your response, and call this function where you are getting Stripe metrics in your application:
sendDataToNewRelic (session)View your Stripe metrics
You can view metrics by querying them or by setting up a Stripe dashboard.
View in query builder
You can use NRQL to query metrics directly in query builder. If you need more information see Introduction to the query builder.
For example, if you want to view net revenue obtained from Stripe, try this query in the query builder:
SELECT stripe.amount_total FROM Metric WHERE metricName = 'stripe_metrics'Install our Stripe monitoring dashboard
To set up our pre-built Stripe dashboard to monitor your application metrics, go to the Stripe dashboard installation and follow the instructions. Once installed, the dashboard should display metrics.
If you need help with dashboards, see:
- Introduction to dashboards to customize your dashboard and carry out different actions.
- Manage your dashboard to adjust your display mode, or to add more content to your dashboard.