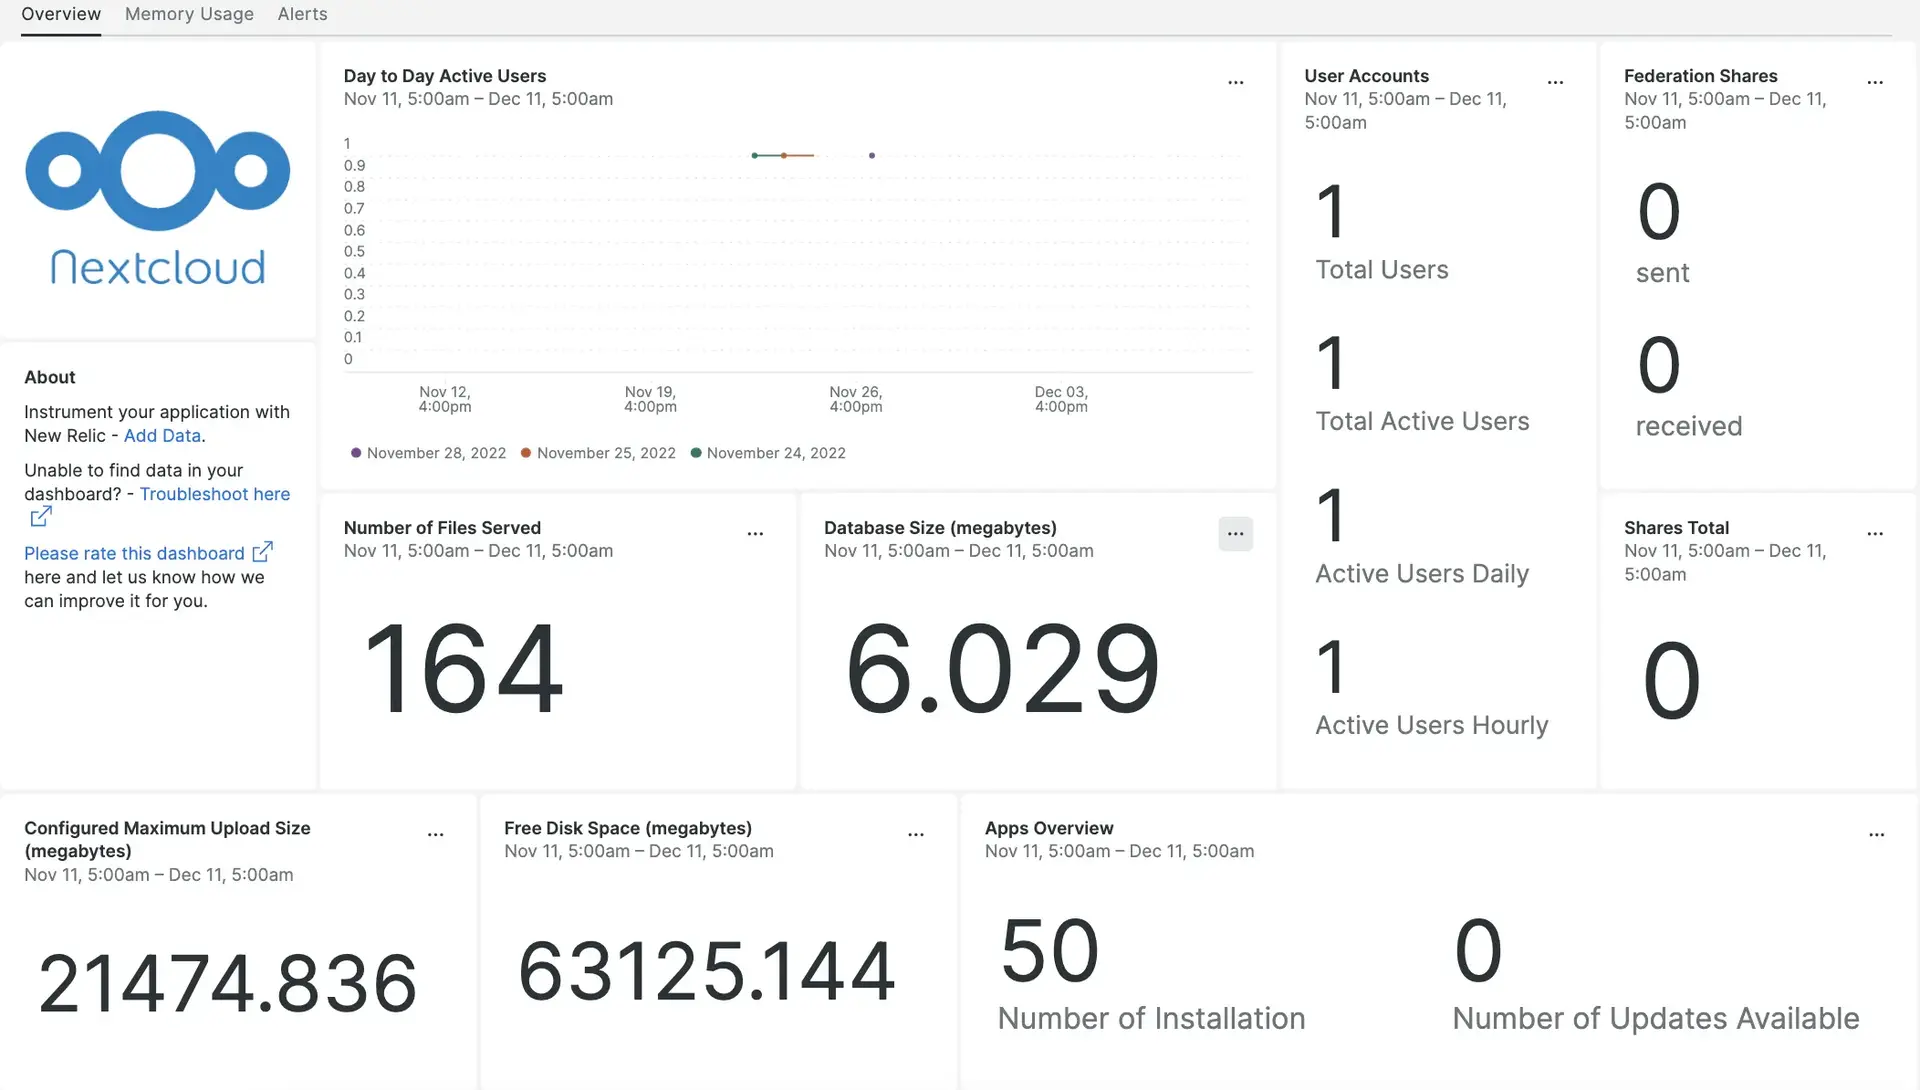
With our Nextcloud dashboard, you can easily track the number of files in your system, your user accounts, and your database size. Built with our infrastructure agent and Prometheus OpenMetrics integration, the Nextcloud integration gives you a set of default that let you view your most critical data all in one place.

After setting up the Nextcloud integration with New Relic, your data displays in dashboards like these right out of the box.
Complete the following steps to install the integration:
Install the infrastructure agent
To use the Nextcloud integration, you need to first install the infrastructure agent on the same host. The infrastructure agent monitors the host itself, while the integration you'll install in the next step extends your monitoring with Nexcloud-specific data.
Configure NRI-Flex for Nextcloud
Our flex integration comes bundled with the New Relic infrastructure agent and is used to send your Nextcloud data to New Relic. To create a flex configuration file follow these steps:
Create a file named
nri-flex-nextcloud.ymlin/etc/newrelic-infra/integrations.dUse our configuration template to update the fields
YOUR_EVENT_TYPEandYOUR_HOST_IPin the file namednri-flex-nextcloud.yml. The value on theevent_typeis used to store metrics in the NRDB. For example, you can updateEVENT_TYPEtoNextcloudFlexMetricsYour
nri-flex-nextcloud.ymlfile should look like this:integrations:- name: nri-flexconfig:name: nextcloudFlexglobal:base_url: http://YOUR_HOST_IP/ocs/v2.php/apps/serverinfo/api/v1/user: nextcloud_usernamepass: nextcloud_passwordapis:- event_type: YOUR_EVENT_TYPEurl: info?format=jsonMetrics for Nextcloud are available at the following URL:
http://YOUR_HOST_IP/ocs/v2.php/apps/serverinfo/api/v1/info?format=json
Forward Nextcloud logs to New Relic
You can use log forwarding to forward Nextcloud logs to New Relic:
Create a log file named
logging.ymlin/etc/newrelic-infra/logging.d/Add the following script to the
logging.ymlfile:logs:- name: nextcloud.logfile: /var/www/nextcloud/data/nextcloud.logattributes:logtype: nextcloud_log
Restart the New Relic infrastructure agent
Before you can start using your data, restart your infrastructure agent.
The following command should work for most systems:
$sudo systemctl restart newrelic-infra.serviceFind your data
You can choose our pre-built dashboard template named Nextcloud to monitor your Nextcloud server metrics. Follow these steps to use our pre-built dashboard template:
From one.newrelic.com, go to the + Integrations & Agents page.
Click on Dashboards.
In the search bar, type
Nextcloud.The Nextcloud dashboard should appear. Click on it to install it.
Your Nextcloud dashboard is considered a custom dashboard and can be found in the Dashboards UI. For docs on using and editing dashboards, see our dashboard docs.
Here's an example of NRQL query checking the number of active users for the last 5 minutes:
FROM NextcloudFlexMetrics SELECT latest(ocs.data.activeUsers.last5minutes)Here's an example of NRQL query checking the number of active users in the last 24 hours:
FROM NextcloudFlexMetrics SELECT latest(ocs.data.activeUsers.last24hours)
What's next?
To learn more about building NRQL queries and generating dashboards:
- Read our introduction to the query builder to create basic and advanced queries.
- Read our introduction to dashboards to customize your dashboard and carry out different actions.
- See how to manage your dashboard to adjust your display mode, or to add more content to your dashboard.