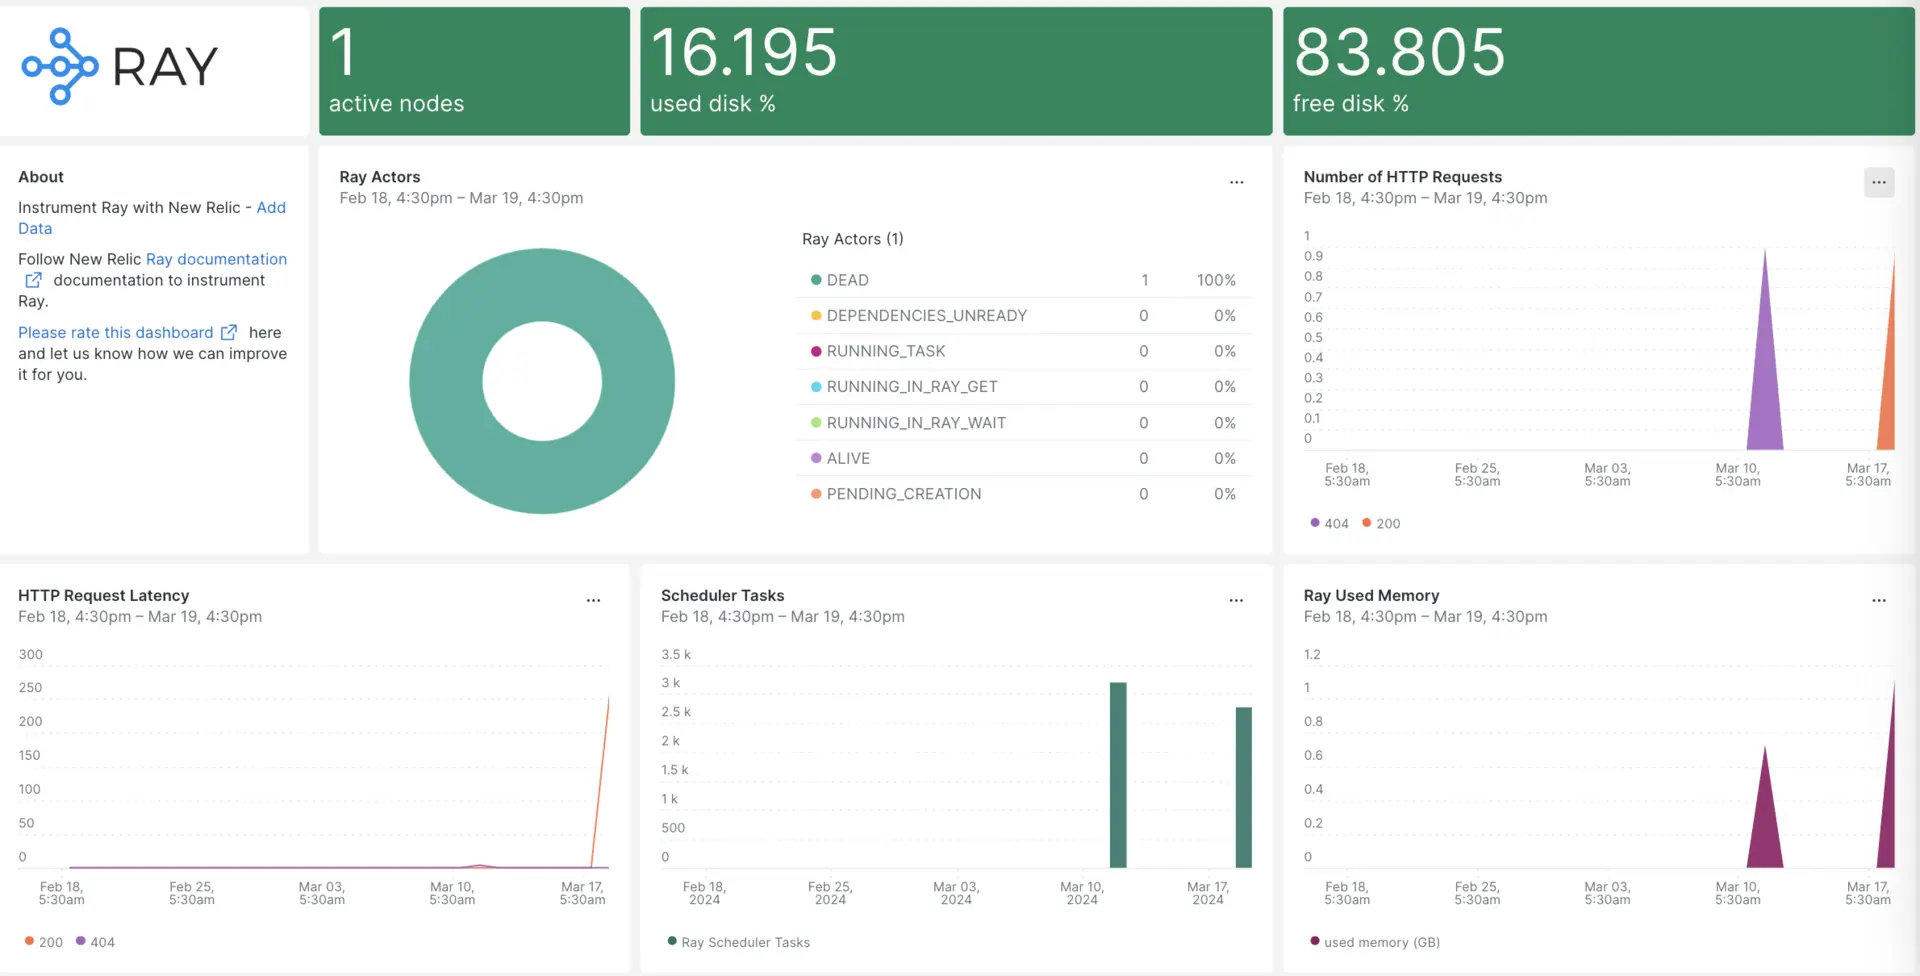
Our Ray integration monitors the performance of your Ray, helping you diagnose and optimize the Ray clusters, ML tasks such as data preprocessing, distributed training, hyperparameter tuning, reinforcement learning, and model serving and scaling Python applications. Our Ray integration makes use of our infrastructure agent and NRI-Prometheus gives you a pre-built dashboard with your most important Ray metrics.

After setting up the integration with New Relic, see your data in dashboards like these, right out of the box.
Install the infrastructure agent
To use the Ray integration, you need to first install the infrastructure agent on the same host. The infrastructure agent monitors the host itself, while the Ray integration extends your monitoring with data specific to Ray clusters.
Install the Prometheus integration
Download the latest Prometheus release from the Prometheus download page. Select the appropriate version for your operating system and architecture. For Linux, you'll likely choose the linux-amd64 version. Copy the download link for the tarball (
.tar.gzfile).Once Prometheus is downloaded, extract the download tar file:
bash$tar -xvzf <filename.tar.gz>Navigate to the extracted Prometheus folder and run the below command to start the Prometheus service:
bash$cd /DOWNLOADED-FOLDER/bash$./prometheus --config.file=/tmp/ray/session_latest/metrics/prometheus/prometheus.ymlWhen Prometheus starts, it operates on port 9090. Navigate to the Prometheus web interface, select
Statusand click on the desired target to view the Ray metrics endpoint URLs, as shown below:http://YOUR_DOMAIN:64415/metrics, http://YOUR_DOMAIN:44217/metrics, http://YOUR_DOMAIN:44227/metrics
Configure nri-prometheus for Ray
Create a file named
nri-prometheus-config.ymlin the following path:bash$/etc/newrelic-infra/integrations.dAdd the following snippet to your
nri-prometheus-config.ymlfile that enables the agent to capture Ray data:integrations:- name: nri-prometheusconfig:standalone: false# Defaults to true. When standalone is set to `false`, `nri-prometheus` requires an infrastructure agent to send data.emitters: infra-sdk# When running with infrastructure agent emitters will have to include infra-sdkcluster_name: Ray_Metrics# Match the name of your cluster with the name seen in New Relic.targets:- description: Ray_Metricsurls: ["http://<YOUR_HOST_IP>:64747/metrics", "http://<YOUR_HOST_IP>:44217/metrics", "http://<YOUR_HOST_IP>:44227/metrics"]# tls_config:# ca_file_path: "/etc/etcd/etcd-client-ca.crt"# cert_file_path: "/etc/etcd/etcd-client.crt"# key_file_path: "/etc/etcd/etcd-client.key"verbose: false# Defaults to false. This determines whether or not the integration should run in verbose mode.audit: false# Defaults to false and does not include verbose mode. Audit mode logs the uncompressed data sent to New Relic and can lead to a high log volume.# scrape_timeout: "YOUR_TIMEOUT_DURATION"# `scrape_timeout` is not a mandatory configuration and defaults to 30s. The HTTP client timeout when fetching data from endpoints.scrape_duration: "5s"# worker_threads: 4# `worker_threads` is not a mandatory configuration and defaults to `4` for clusters with more than 400 endpoints. Slowly increase the worker thread until scrape time falls between the desired `scrape_duration`. Note: Increasing this value too much results in huge memory consumption if too many metrics are scraped at once.insecure_skip_verify: false# Defaults to false. Determins if the integration should skip TLS verification or not.timeout: 10s
Forward Ray logs to New Relic
You can use our log forwarding capability to forward Ray logs to New Relic.
Edit the log file named
logging.ymllocated at the following path:bash$cd /etc/newrelic-infra/logging.d/Add the following script to the
logging.ymlfile:- name: dashboard.logfile: /tmp/ray/session_latest/logs/dashboard.logattributes:logtype: ray_dashboard_logs- name: monitor.logfile: /tmp/ray/session_latest/logs/monitor.logattributes:logtype: ray_monitor_logs- name: log_monitor.logfile: /tmp/ray/session_latest/logs/log_monitor.logattributes:logtype: ray_log_monitor_logs
Restart the infrastructure agent
Use the instructions in our infrastructure agent docs to restart your infrastructure agent. This is a basic command that should work for most people:
$sudo systemctl restart newrelic-infra.serviceView your Ray metrics in New Relic
Once you've completed the setup above, you can view your metrics using our pre-built dashboard template. To access this dashboard:
Go to one.newrelic.com > + Integrations & Agents.
Click on the Dashboards tab.
In the search box, type
Ray.Select it and click Install.
To instrument the Apache Druid quickstart and to see metrics and alerts, you can also follow our Ray quickstart page by clicking on the Install now button.
Here's an example query to check active nodes in your Ray cluster:
SELECT latest(ray_cluster_active_nodes) FROM Metric
What's next?
To learn more about building NRQL queries and generating dashboards, check out these docs:
- Introduction to the query builder to create basic and advanced queries.
- Introduction to dashboards to customize your dashboard and carry out different actions.
- Manage your dashboard to adjust your dashboards display mode, or to add more content to your dashboard.