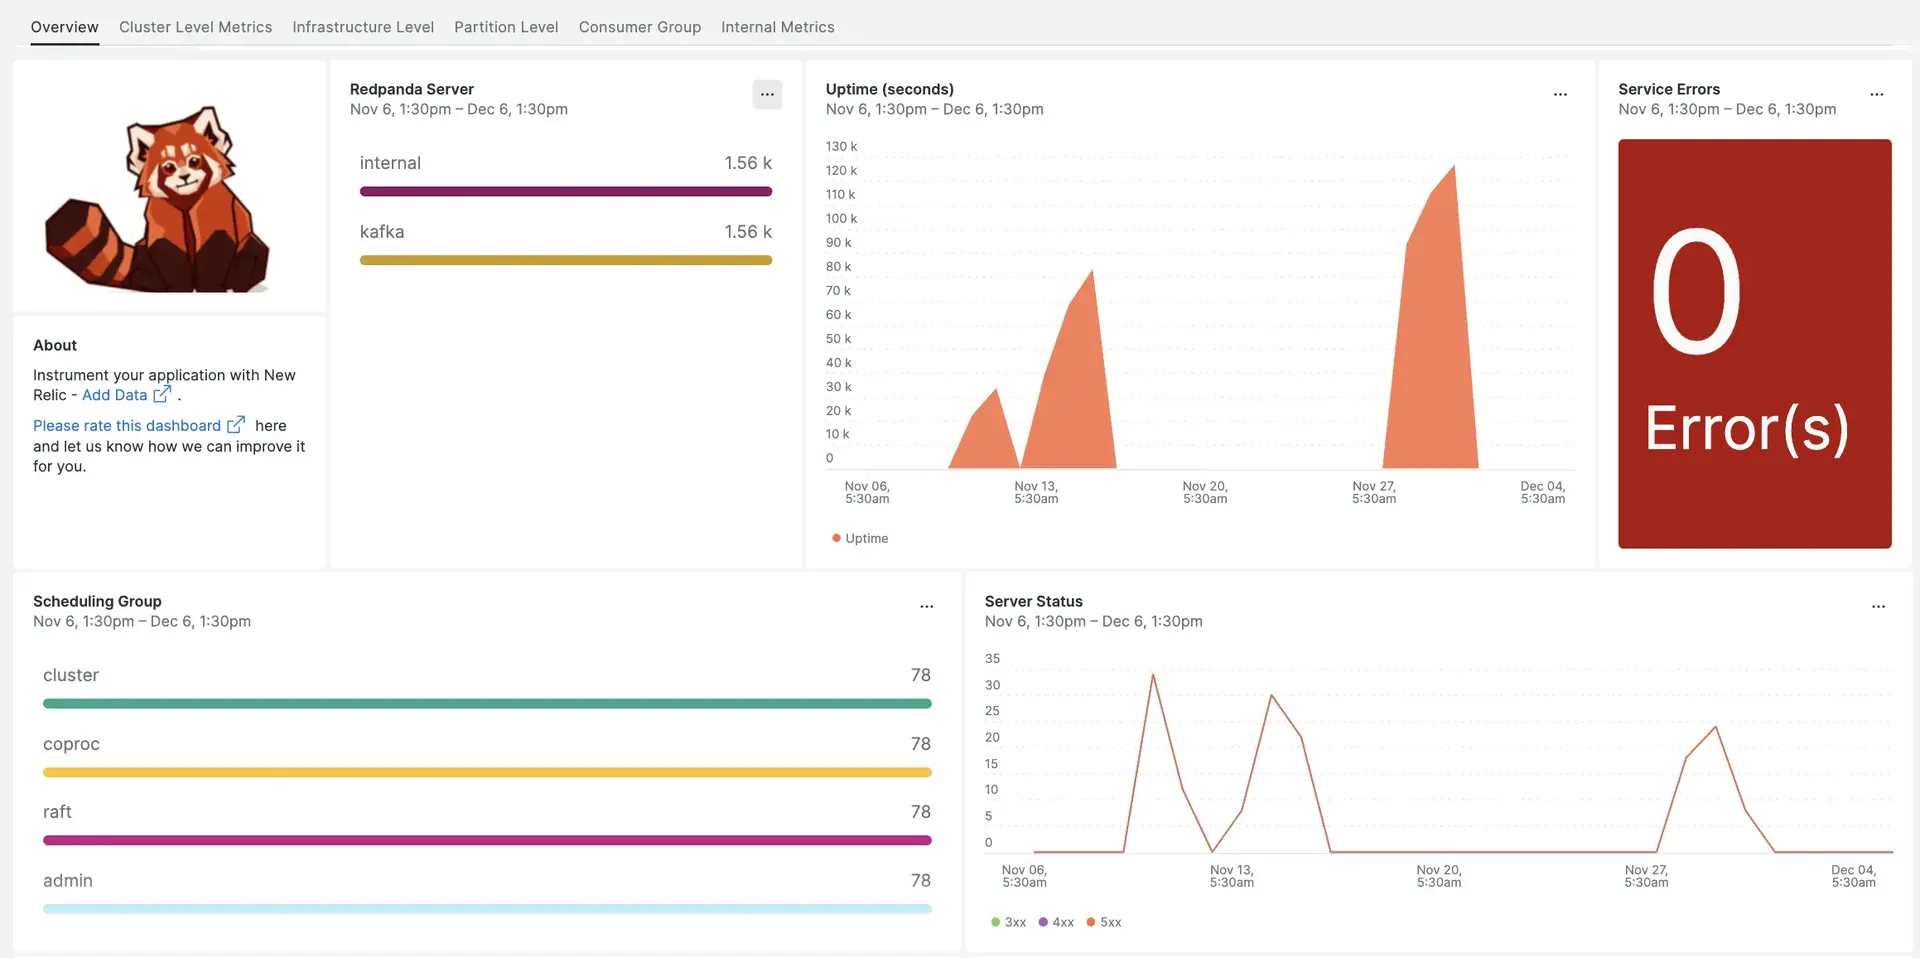
Our RedPanda integration captures cluster-level metrics, data about scheduling groups, and details about your service errors and uptime, then displays that data in a pre-built .

After setting up Redpanda with New Relic, your data will display in a dashboard, right out of the box.
Complete the following steps to install the integration:
Install the infrastructure agent
To use the RedPanda integration, you need to first install the infrastructure agent on the same host. The infrastructure agent monitors the host itself, while the integration you'll install in the next step extends your monitoring with RedPanda-specific data.
Configure integration
Create a file named
nri-prometheus-config.ymlin/etc/newrelic-infra/integrations.d.Add the following snippet to your
nri-prometheus-config.ymlfile to enable the capture of RedPanda data. Be sure to edit the config file with your info:integrations:- name: nri-prometheusconfig:# When standalone is set to false, nri-prometheus requires an infrastructure agent to work and send data. Defaults to truestandalone: false# If using the infrastructure agent, emitters have to include infra-sdkemitters: infra-sdk# The name of your cluster. The name of your cluster must be consistent across New Relic products so the infrastructure agent and nri-prometheus can scrape data from the cluster.cluster_name: "YOUR_EXPORTER_NAME"targets:- description: Redpanda metrics are captured in the below urlsurls: ["http://localhost:9644/metrics", "http://localhost:9644/public_metrics"]# tls_config:# ca_file_path: "/etc/etcd/etcd-client-ca.crt"# cert_file_path: "/etc/etcd/etcd-client.crt"# key_file_path: "/etc/etcd/etcd-client.key"# Specifies whether or not the integration should run in verbose mode. Defaults to false.verbose: false# Specifies whether or not the integration should run in audit mode. Defaults to false.# Audit mode logs the uncompressed data sent to New Relic. Use this to log all data sent.# It does not include verbose mode. This can lead to a high log volume, use with care.audit: false# The HTTP client timeout when fetching data from endpoints. Defaults to "5s" if it's not set.# scrape_timeout: "5s"# Length in time to distribute the scraping from the endpoints. Default to "30s" if it's not set.scrape_duration: "5s"# Number of worker threads used for scraping targets.# For large clusters with many (>400) endpoints, slowly increase until scrape# time falls between the desired `scrape_duration`.# Increasing this value too much will result in huge memory consumption if too# many metrics are being scraped.# Default: 4# worker_threads: 4#Specifies whether or not the integration should skip TLS verification. Defaults to false.insecure_skip_verify: falsetimeout: 10s
Restart the New Relic infrastructure agent
Before you can start using your data, restart your infrastructure agent.
The following command should work for most systems:
$sudo systemctl restart newrelic-infra.serviceFind your data
You can choose our pre-built dashboard template named RedPanda to monitor your Nextcloud server metrics. Follow these steps to use our pre-built dashboard template:
From one.newrelic.com, go to the + Integrations & Agents page.
Click on Dashboards.
In the search bar, type
RedPanda.The RedPanda dashboard should appear. Click on it to install it.
Your Nextcloud dashboard is considered a custom dashboard and can be found in the Dashboards UI. For docs on using and editing dashboards, see our dashboard docs.
What's next?
If you want to customize your RedPanda dashboards, you can learn more about building NRQL queries and managing your dashboards in the New Relic UI:
- Introduction to the query builder to create basic and advanced queries.
- Introduction to dashboards to customize your dashboard and carry out different actions.
- Manage your dashboard to adjust your dashboard display mode, or to add more content to your dashboard.