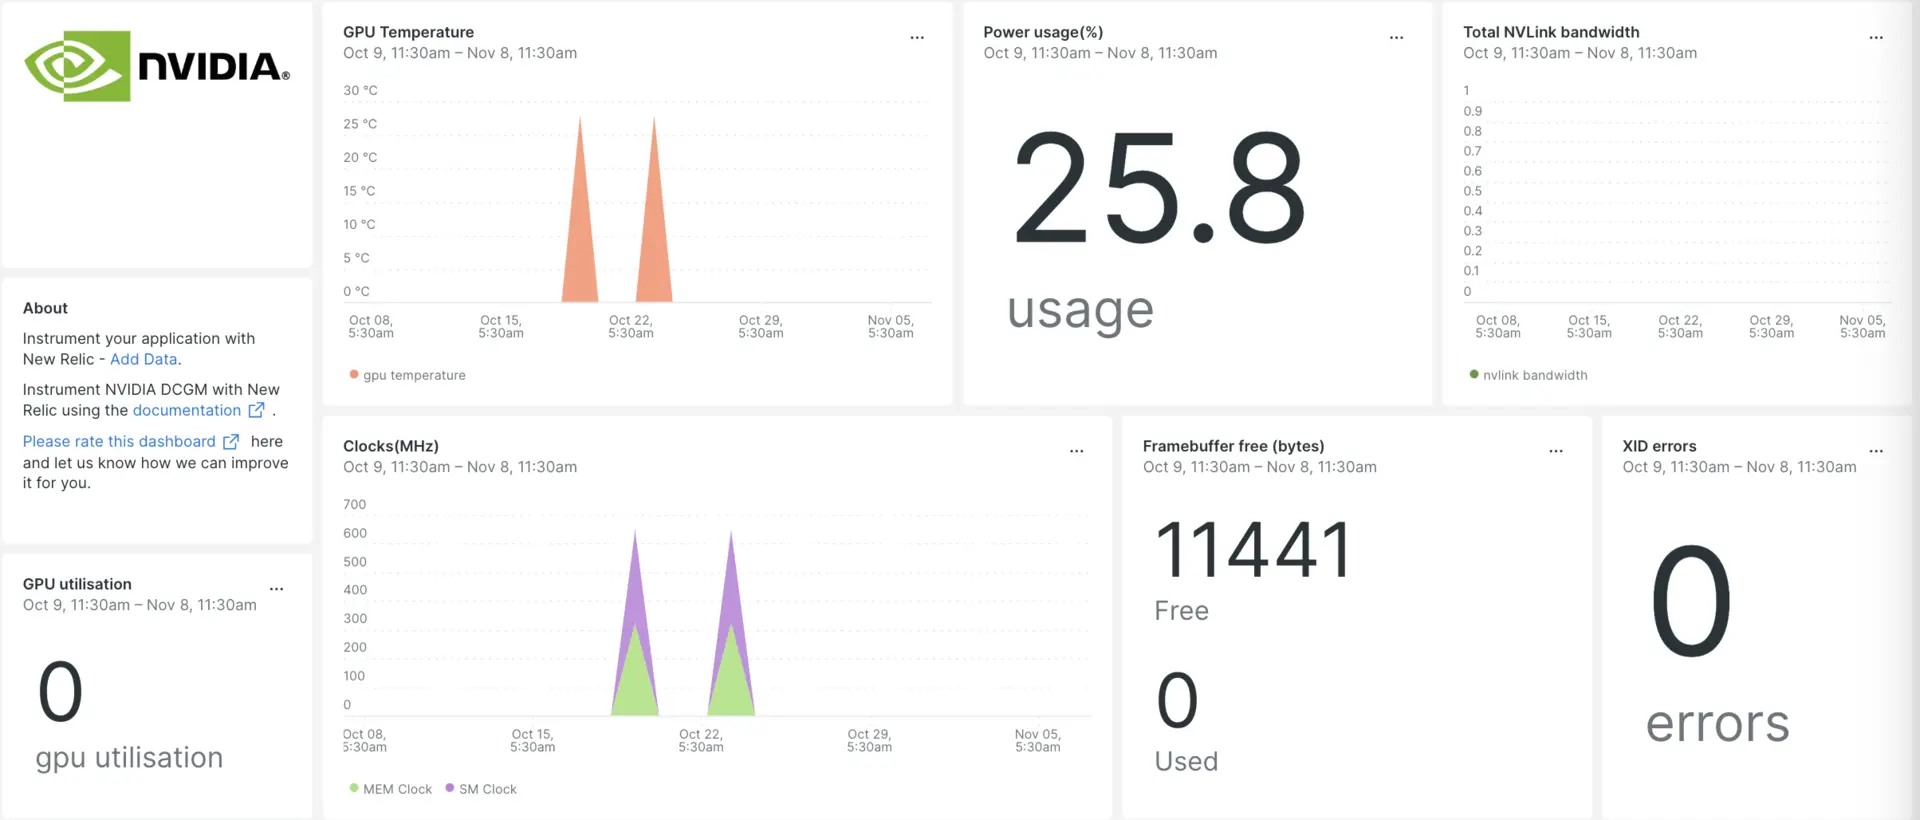
Our NVIDIA DCGM integration assists you in monitoring the status of GPUs. This integration leverages our infrastructure agent and the Prometheus remote write integration, which is seamlessly integrated with NVIDIA's SMI utility. It provides you with a pre-built dashboard containing crucial DCGM metrics, including GPU utilization, XID error counts, clock and performance states, temperature, and power usage.

After you set up our NVIDIA DCGM integration, we give you a dashboard for your DCGM metrics.
Install the infrastructure agent
To get data into New Relic, install our infrastructure agent. Our infrastructure agent collects and ingests data so you can keep track of your DCGM performance.
You can install the infrastructure agent two different ways:
- Our guided install is a CLI tool that inspects your system and installs the infrastructure agent alongside the application monitoring agent that best works for your system. To learn more about how our guided install works, check out our Guided install overview.
- If you'd rather install our infrastructure agent manually, you can follow a tutorial for manual installation for Linux, Windows.
Configure the DCGM exporter
In your terminal, clone the
dcgm-exporterrepository:bash$git clone https://github.com/NVIDIA/dcgm-exporterIn the cloned repository, navigate to the
dcgm-exporterdirectory:bash$cd dcgm-exporterInstall necessary binaries:
bash$make binarybash$sudo make installStart the
dcgm-exporter:bash$dcgm-exporter &See the details of your DCGM metrics:
bash$curl localhost:9400/metrics
NVIDIA-DCGM configuration on Prometheus
Prometheus is an open-source monitoring and alerting tool that can be used to monitor NVIDIA GPUs using the NVIDIA-DCGM exporter. To configure Prometheus to monitor DCGM metrics, follow these steps:
- Visit the Prometheus download page to find the latest release.
- Select the appropriate version for your operating system and architecture. For Linux, you'll likely choose the linux-amd64 version. Copy the download link for the tarball (
.tar.gzfile). - Once Prometheus is downloaded, untar the download tar file:bash$tar -xvzf <filename.tar.gz>
- Navigate to the downloaded Prometheus folder:bash$cd /DOWNLOADED-FOLDER/
- Open your
prometheus.ymlfile and add the following lines:---scrape_configs:- job_name: NVIDIstatic_configs:- targets:['localhost:9400'] - Start Prometheus:bash$./prometheus --config.file=prometheus.yml
Install Prometheus remote write agent for NVIDIA-DCGM
After setting up Prometheus configuration, you have to send NVIDIA DCGM metrics to Prometheus. Later, to integrate Prometheus metrics with New Relic, you can leverage the Prometheus remote write agent. Simply follow the Prometheus remote write setup launcher in the UI.
Restart the New Relic infrastructure agent
Before you can start reading your data, use the instructions in our infrastructure agent docs to restart your infrastructure agent.
$sudo systemctl restart newrelic-infra.serviceView your DCGM metrics in New Relic
Once you've completed the setup above, you can view your metrics using our pre-built dashboard template named nvidia-dcgm. To access this dashboard:
- Go to one.newrelic.com > + Integrations & Agents.
- Click on the Dashboards tab.
- In the search box, type "nvidia-dcgm".
- Select it and click Install.
To instrument the nvidia-dcgm quickstart and to see metrics and alerts, you can also follow our Nvidia-DCGM quickstart page by clicking on the Install now button.
Here are some example queries:
Example: view the count of the device GPU temperature
SELECT latest(DCGM_FI_DEV_GPU_TEMP) FROM Metric WHERE metricName LIKE 'DCGM_FI_DEV_GPU_TEMP' TIMESERIESWhat's next?
To learn more about building NRQL queries and generating dashboards, check out these docs:
- Introduction to the query builder to create basic and advanced queries.
- Introduction to dashboards to customize your dashboard and carry out different actions.
- Manage your dashboard to adjust your display mode, or to add more content to your dashboard.