Gain deep insights into Envoy's operations with seamless data integration into New Relic. Monitor key metrics to ensure the optimal performance of your Envoy backend clusters, listening sockets, HTTP routing, and cryptographic material.

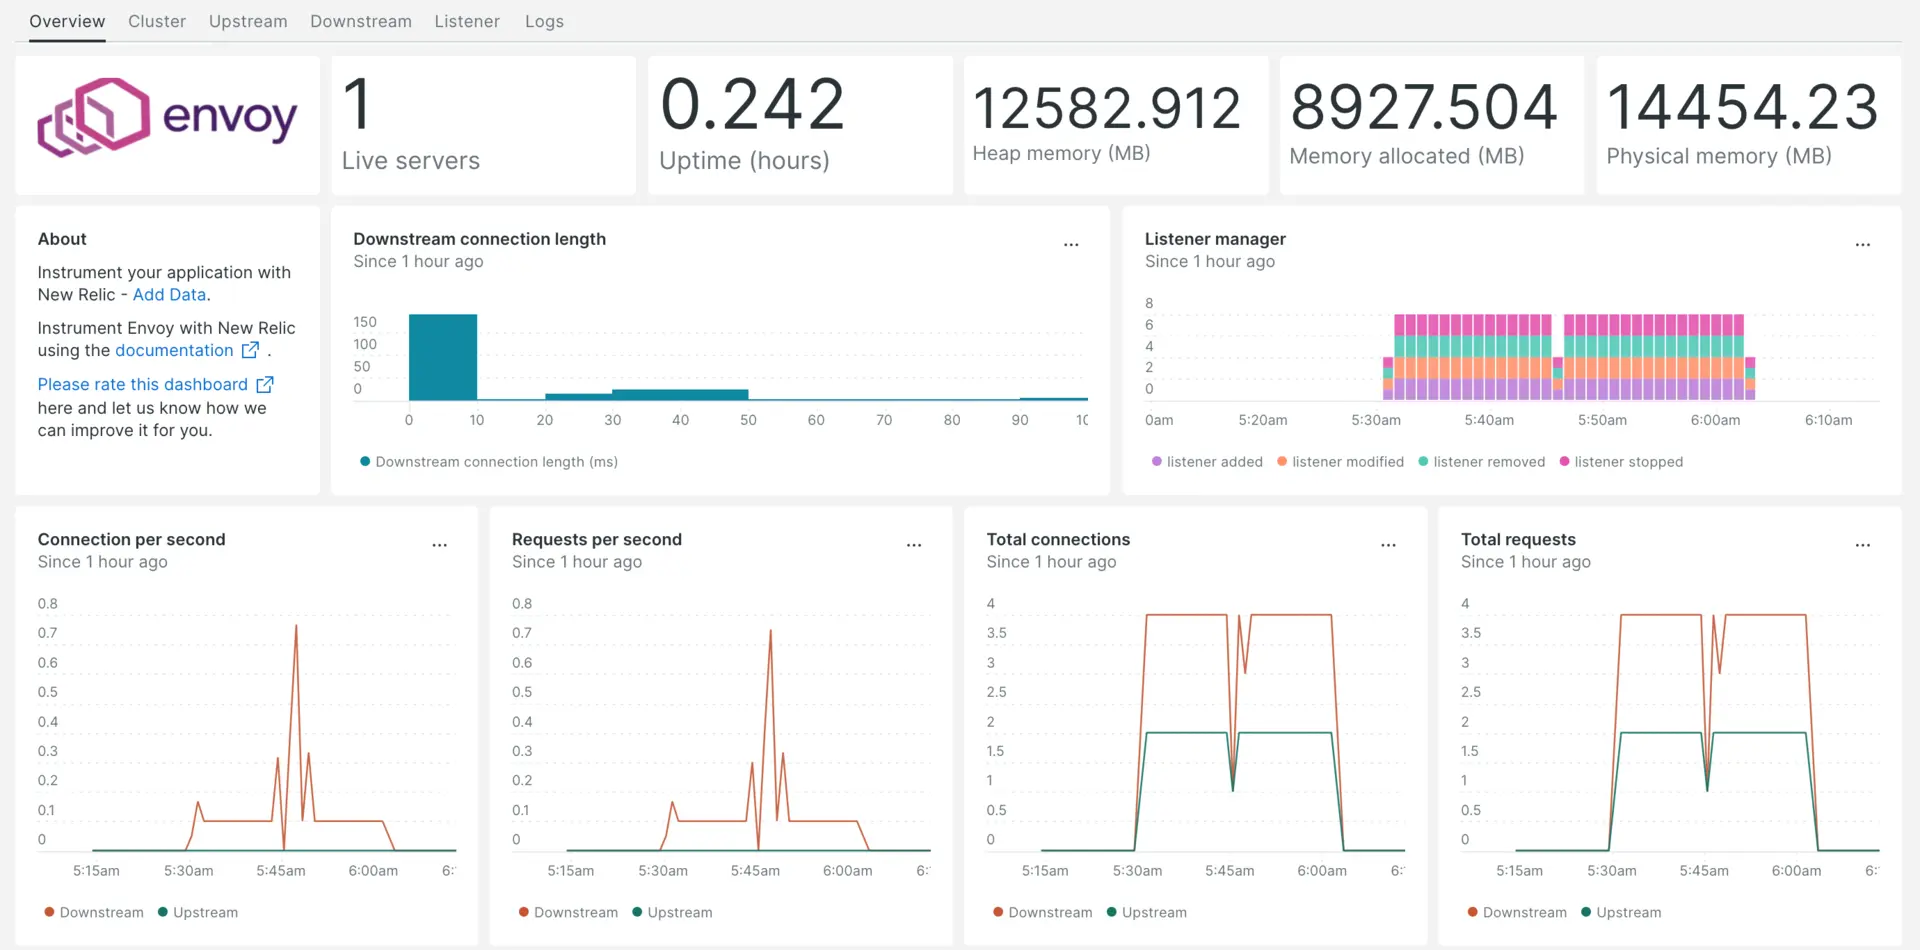
After setting up our Envoy integration, we give you a dashboard for your Envoy metrics.
Install the infrastructure agent
To use the Envoy integration, you need to also install the infrastructure agent on the same host. The infrastructure agent monitors the host itself, while the integration you'll install in the next step extends your monitoring with Envoy-specific data.
Enable the Envoy integration with nri-prometheus
To set up the Envoy integration, follow these steps:
Create a file named
nri-prometheus-config.ymlin the integrations directory:bash$touch /etc/newrelic-infra/integrations.d/nri-prometheus-config.ymlAdd the following snippet to your
nri-prometheus-config.ymlfile to enable the agent to capture Envoy data:integrations:- name: nri-prometheusconfig:# When standalone is set to false nri-prometheus requires an infrastructure agent to work and send data. Defaults to truestandalone: false# When running with infrastructure agent emitters will have to include infra-sdkemitters: infra-sdk# The name of your cluster. It's important to match other New Relic products to relate the data.cluster_name: "YOUR_DESIRED_CLUSTER_NAME"targets:- description: Envoy metrics listurls: ["http://<ip-address>:9901/stats/prometheus"]# tls_config:# ca_file_path: "/etc/etcd/etcd-client-ca.crt"# cert_file_path: "/etc/etcd/etcd-client.crt"# key_file_path: "/etc/etcd/etcd-client.key"# Whether the integration should run in verbose mode or not. Defaults to falseverbose: false# Whether the integration should run in audit mode or not. Defaults to false.# Audit mode logs the uncompressed data sent to New Relic. Use this to log all data sent.# It does not include verbose mode. This can lead to a high log volume, use with careaudit: false# The HTTP client timeout when fetching data from endpoints. Defaults to 30s.# scrape_timeout: "30s"# Length in time to distribute the scraping from the endpointsscrape_duration: "5s"# Number of worker threads used for scraping targets.# For large clusters with many (>400) endpoints, slowly increase until scrape# time falls between the desired `scrape_duration`.# Increasing this value too much will result in huge memory consumption if too# many metrics are being scraped.# Default: 4# worker_threads: 4# Whether the integration should skip TLS verification or not. Defaults to falseinsecure_skip_verify: truetimeout: 10s
Forward Envoy logs
Follow these steps to forward Envoy logs to New Relic:
Edit the log file named
logging.ymllocated at the following path:bash$cd /etc/newrelic-infra/logging.dAdd the following script to the
logging.ymlfile. Replacefilewith your Envoy log filepath if needed:logs:- name: envoy.logfile: /tmp/envoy.logattributes:logtype: envoy_logs- name: envoy-admin.logfile: /tmp/admin_access.logattributes:logtype: envoy_admin_logs
Restart the New Relic infrastructure agent
Restart your infrastructure agent.
$sudo systemctl restart newrelic-infra.serviceIn a couple of minutes, your application will send metrics to one.newrelic.com.
Find your data
You can choose our pre-built dashboard template named Envoy to monitor your Envoy application metrics. Follow these steps to use our pre-built dashboard template:
From one.newrelic.com, go to the + Integrations & Agents page
Click on Dashboards
In the search bar, type
EnvoyThe Envoy dashboard should appear. Click on it to install it
Your Envoy dashboard is considered a custom dashboard and can be found in the Dashboards UI. For docs on using and editing dashboards, see our dashboard docs.
Here is a NRQL query to check the Envoy downstream total connections:
SELECT latest(envoy_http_downstream_cx_total) as 'Downstream total connections' from Metric
What's next?
To learn more about building NRQL queries and generating dashboards, check out these docs:
- Introduction to the query builder to create basic and advanced queries.
- Introduction to dashboards to customize your dashboard and carry out different actions.
- Manage your dashboard to adjust your dashboards display mode, or to add more content to your dashboard.