New Relic's Windows services integration collects data about the services running on your Microsoft Windows hosts and sends it to our platform. You can check the state and start mode of each service, find out which hosts are running a service, set up for services, and more.
With our Windows services integration you can:
- Check all your Windows services, their state (running, stopped, etc.), start mode (auto, manual, etc.), and other service metadata.
- See which hosts are running specific Windows services.
- Set alerts based on any Windows services that you are monitoring using New Relic.
- Install the Windows Services Quickstart or create your own to track your Windows services.
Our integration is bundled with the Windows infrastructure agent. If you're monitoring Windows hosts on New Relic, you only need to enable the integration to get Windows services data into our platform.

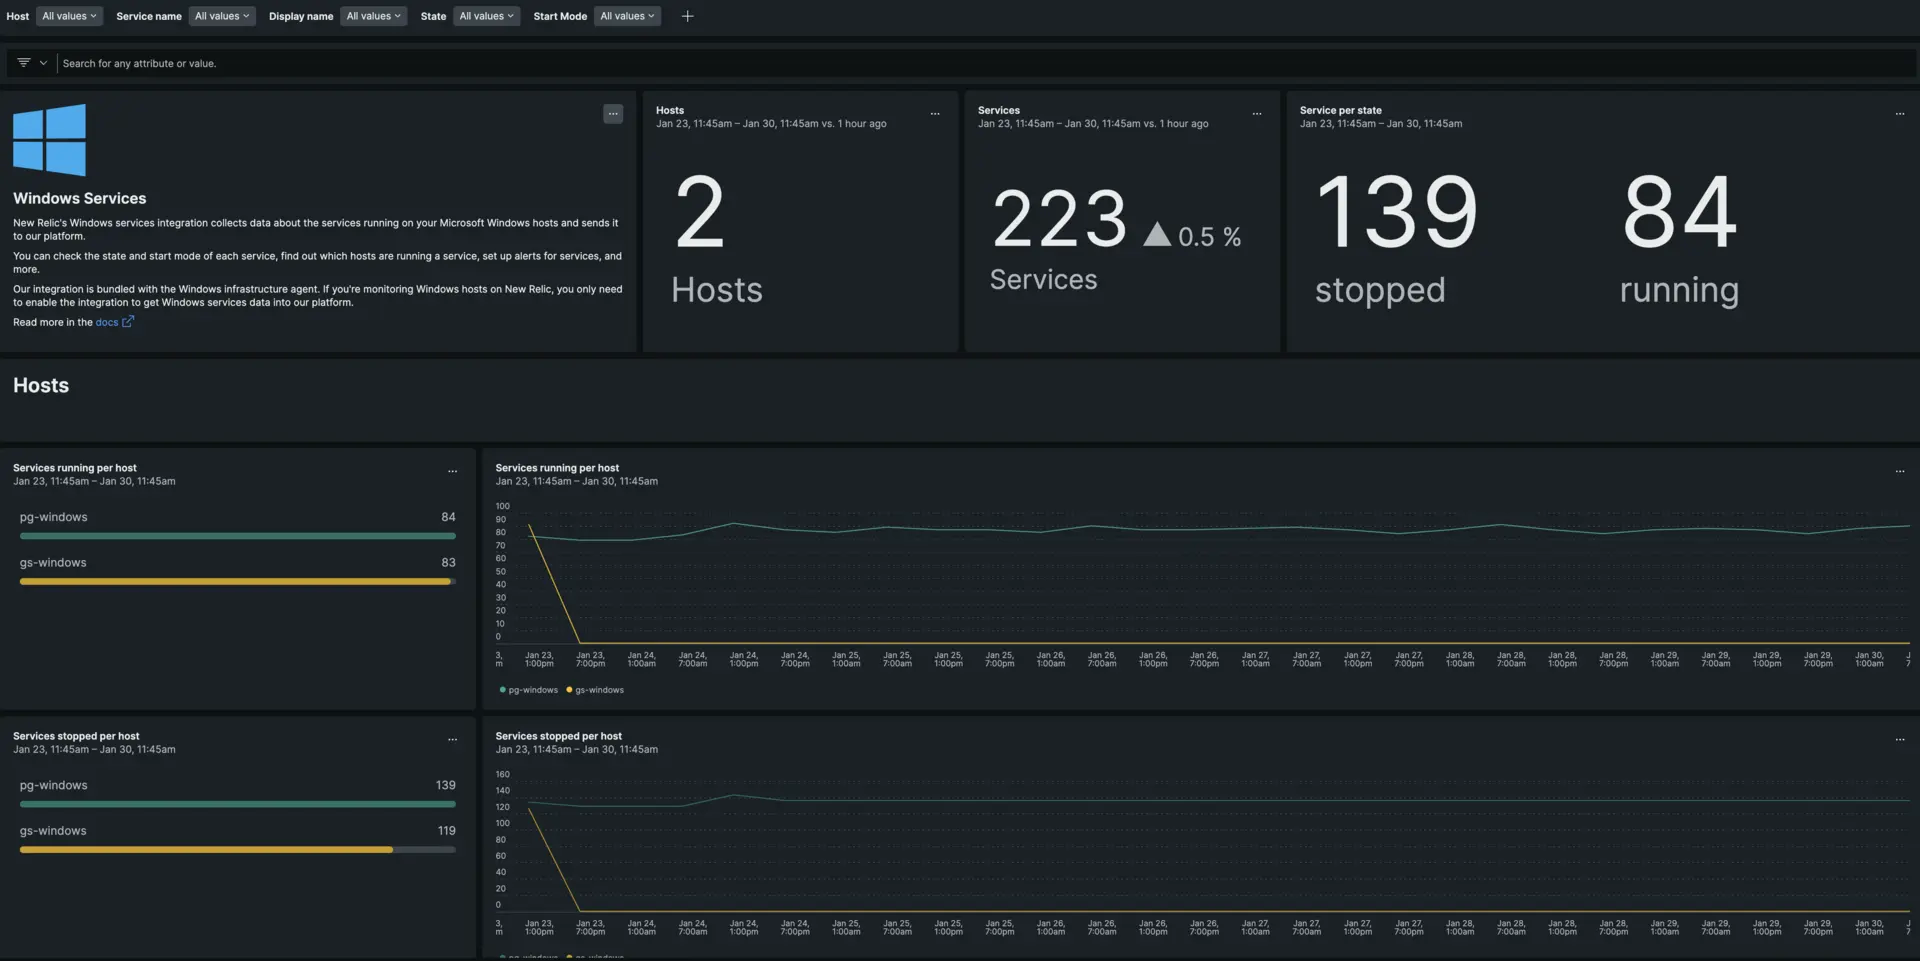
one.newrelic.com > All capabilities > Dashboards: You can use the Microsoft Windows services integration metrics to create tables for your services.
Compatibility and requirements
Our integration is compatible with all Windows versions supported by the New Relic infrastructure agent.
You must have version 1.12.1 or higher for our infrastructure agent installed on a supported host. The x86 Windows versions are not yet supported.
Install the infrastructure agent
To use the Windows services integration, you need to first install the infrastructure agent on the same host. All our on-host integrations require the infrastructure agent, which helps expose and report metrics to New Relic.
Configure the Windows services integration
To activate and configure the Windows services integration:
Change the directory to the integrations folder:
bash$cd C:\Program Files\New Relic\newrelic-infra\integrations.d\Copy the sample configuration file:
bash$copy winservices-config.yml.sample winservices-config.ymlEdit the
winservices-config.ymlfile. By default, no service is included. To include and filter services, you must editinclude_matching_entities:and/orexclude_matching_entities:.Here's an example of the Windows services integration configuration with both a regex pattern matching all services named
win32.*and a direct match for thenewrelic-infraservice. You can also useexclude_matching_entitiesto filter out specific services you do not want to monitor:integrations:- name: nri-winservicesconfig:exporter_bind_address: 127.0.0.1exporter_bind_port: 9182include_matching_entities:windowsService.name:- regex "win32.*"- "newrelic-infra"exclude_matching_entities:windowsService.name:- regex "test.*"- "unwanted-service"scrape_interval: 30slabels:env: productionrole: load_balancertimeout: 60sFor more information, see our documentation about the general structure of on-host integration configurations.
Restart the New Relic infrastructure agent
Restart your infrastructure agent:
$net stop newrelic-infra && net start newrelic-infraIn a couple of minutes, your application will send metrics to one.newrelic.com.
Find your data
You can choose our pre-built dashboard template named Windows services integration to monitor your Windows services. Follow these steps to use our pre-built dashboard template:
From one.newrelic.com, go to the + Integrations & Agents page.
Click on Dashboards.
In the search bar, type
Windows services.The Windows services dashboard should appear. Click on it to install it.
Your Windows services dashboard is considered a custom dashboard and can be found in the Dashboards UI. For docs on using and editing dashboards, see our dashboard docs.
Set up an alert
You can create Windows services using NRQL conditions to get notified about state changes of the services you wish to monitor. Here are two examples of alert conditions that use Windows services data:
How it works
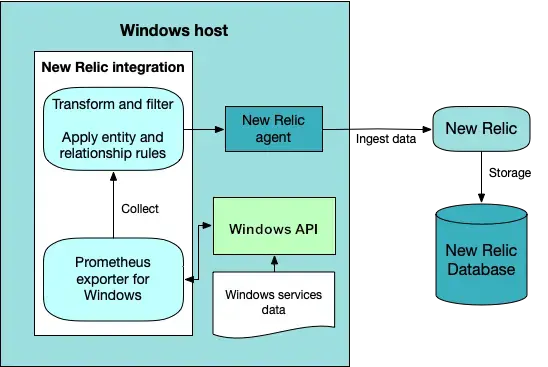
To get data from Windows hosts, our Windows services integration uses a reduced version of the Prometheus exporter for Windows, which exposes Prometheus metrics on the port specified in the agent configuration. The integration collects these metrics, transforms them into entities, filters them, and then sends them to New Relic.

The Windows services integration collects Service Functions data using the Windows Prometheus exporter. It then transforms and filters the data before sending it to New Relic.
Metric data
The Windows services integration provides the following data:
Tip
This integration creates dimensional metrics, which return the numeric status supplied by the Win32_Service class. Enumeration of these metrics into readable string values is provided under the start_mode and state attributes.
Metric Name | Enumerated Attribute | Description |
|---|---|---|
|
| Start mode of the service. Possible values are:
|
|
| State of the service. Possible values are:
|
Labels
You can also decorate your metrics and tags with labels. Labels allow you to add key/value pair attributes to your metrics & tags so that you can query, filter, or group your metrics and use tags for grouping, searching and filtering the data about your entities.
Even though our default sample configuration file includes examples of labels, they're optional. You can remove, modify, or add new ones.
labels: env: production role: load_balancerMetadata
The Windows services integration sends the following metadata to New Relic:
display_name: Name of the service as viewed in the services snap-in.process_id: Process identifier of the service.run_as: Account name under which a service runs. Depending on the service type, the format of the account name may beDomainName\UsernameorUsername@DomainName(UPN). The value is taken from theStartNameattribute of theWin32_Serviceclass, which can beNULL(in that case, the label is reported as an empty string).Important
If the
StartNameattribute isNULL, the service is logged on under theLocalSystemaccount. For kernel or system-level drive, it runs with a default object name that the the I/O system creates based on the service name, for example,DWDOM\Admin.service_name: Unique identifier of the service.Important
The system converts
service_nameto lowercase per best practices. It replaces all spaces and periods with underscores. It isn't the the same as the service name on the Windows interface.
Source code
The Windows services integration is open source software. That means you can browse its source code and send improvements, or create your own fork and build it. For more information, see the README.