Our NVIDIA Triton integration monitors the deployment and management of AI models in production environments. Triton provides a flexible and scalable solution for deploying deep learning models, enabling organizations to efficiently deploy AI applications across a variety of hardware platforms, including GPUs and CPUs.

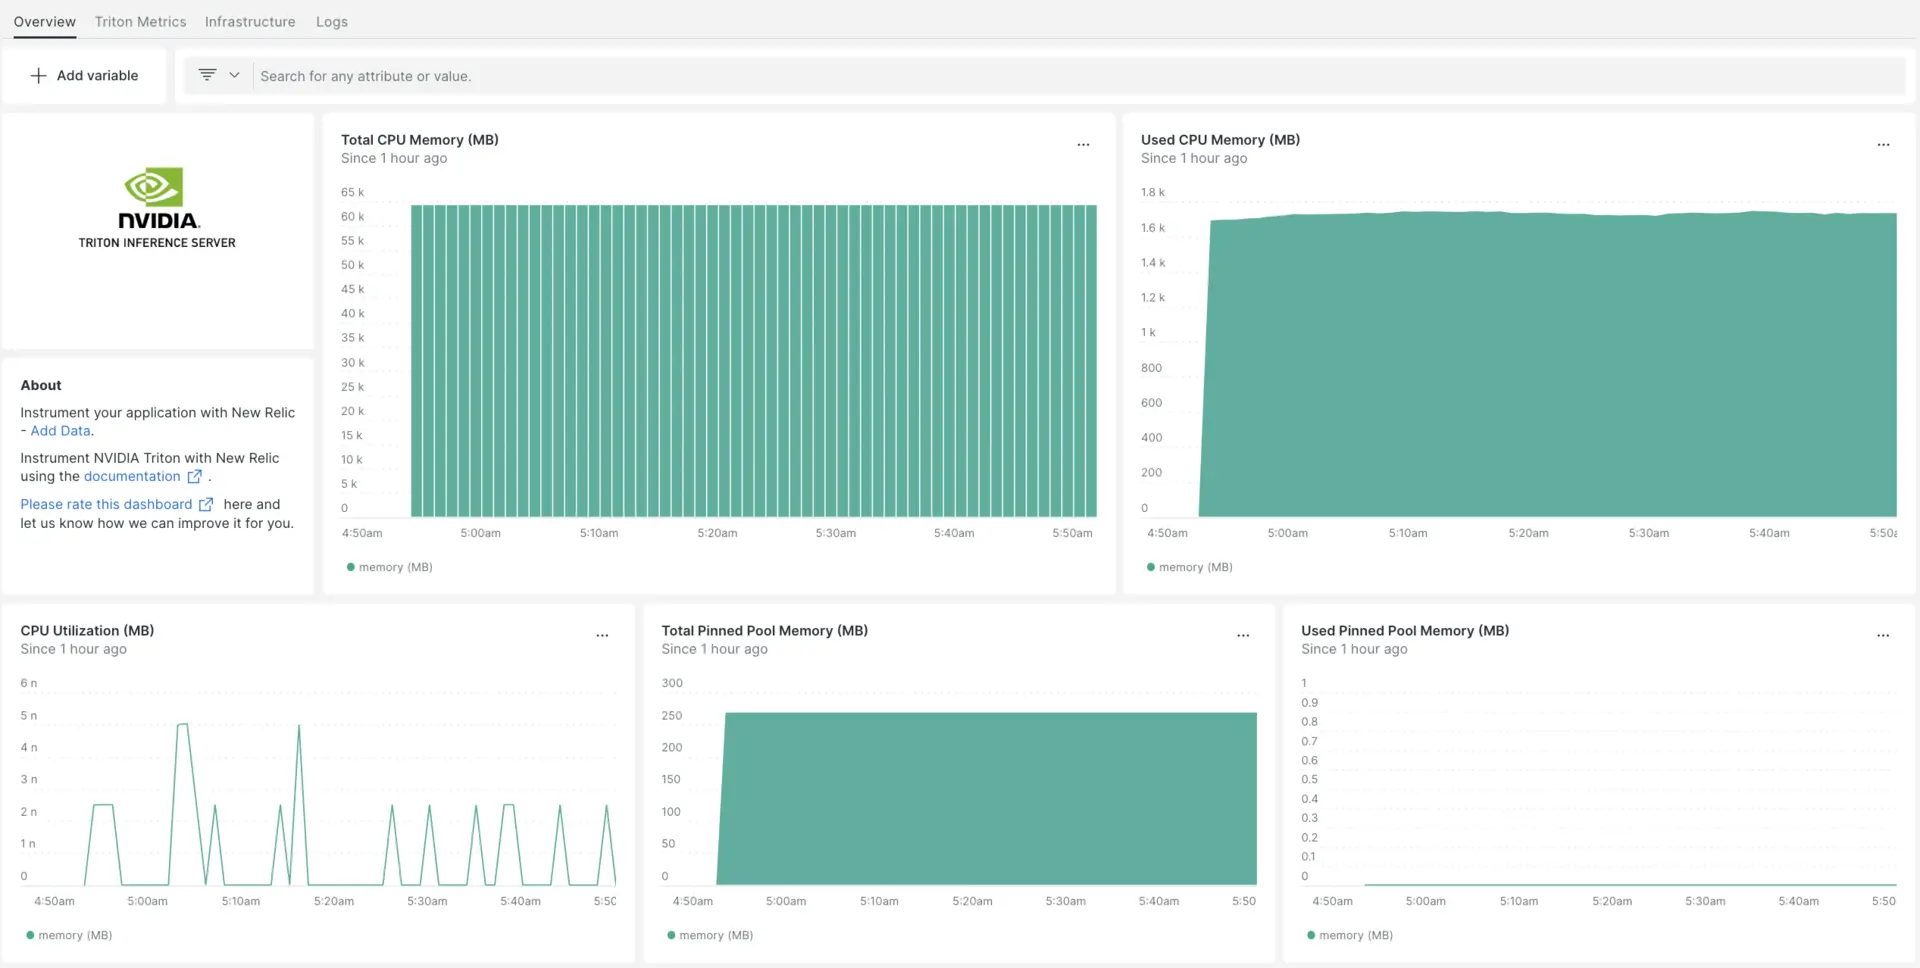
After setting up our NVIDIA Triton integration, we give you a dashboard for your NVIDIA Triton metrics.
Install the infrastructure agent
To use the NVIDIA Triton integration, you need to also install the infrastructure agent on the same host. The infrastructure agent monitors the host itself, while the integration you'll install in the next step extends your monitoring with NVIDIA Triton-specific data.
Enable the NVIDIA Triton integration with nri-prometheus
The Triton server metrics are displayed at the URL http://localhost:8002/metrics.
Tip
For additional details on collecting Triton server metrics, please refer to the NVIDIA documentation
To set up the NVIDIA Triton integration, follow these steps:
Run this command to create a file named
nri-prometheus-config.ymlin the integrations directory:bash$touch /etc/newrelic-infra/integrations.d/nri-prometheus-config.ymlAdd the following snippet to your
nri-prometheus-config.ymlfile to enable the agent to capture NVIDIA Triton data:integrations:- name: nri-prometheusconfig:# When standalone is set to false nri-prometheus requires an infrastructure agent to work and send data. Defaults to truestandalone: false# When running with infrastructure agent emitters will have to include infra-sdkemitters: infra-sdk# The name of your cluster. It's important to match other New Relic products to relate the data.cluster_name: "YOUR_DESIRED_CLUSTER_NAME"targets:- description: NVIDIA Triton metrics listurls: ["http://localhost:8002/metrics"]# tls_config:# ca_file_path: "/etc/etcd/etcd-client-ca.crt"# cert_file_path: "/etc/etcd/etcd-client.crt"# key_file_path: "/etc/etcd/etcd-client.key"# Whether the integration should run in verbose mode or not. Defaults to falseverbose: false# Whether the integration should run in audit mode or not. Defaults to false.# Audit mode logs the uncompressed data sent to New Relic. Use this to log all data sent.# It does not include verbose mode. This can lead to a high log volume, use with careaudit: false# The HTTP client timeout when fetching data from endpoints. Defaults to 30s.# scrape_timeout: "30s"# Length in time to distribute the scraping from the endpointsscrape_duration: "5s"# Number of worker threads used for scraping targets.# For large clusters with many (>400) endpoints, slowly increase until scrape# time falls between the desired `scrape_duration`.# Increasing this value too much will result in huge memory consumption if too# many metrics are being scraped.# Default: 4# worker_threads: 4# Whether the integration should skip TLS verification or not. Defaults to falseinsecure_skip_verify: truetimeout: 10s
NVIDIA Triton logs configuration
To configure nvidia triton logs, follow the steps outlined below.
Run this Docker command to check the status of running containers:
bash$sudo docker psCopy the container ID for the nvidia-triton container and execute this command:
bash$sudo docker logs -f <container_id> &> /tmp/triton.log &Afterwards, verify there is a log file named
triton.loglocated in the/tmp/directory.
Forwarding NVIDIA Triton logs to New Relic
You can use our log forwarding to forward NVIDIA Triton logs to New Relic.
On Linux machines, your log file named logging.yml should be in this path:
$cd /etc/newrelic-infra/logging.d/Once you find the log file in the above path, include this script into the logging.yml file:
logs: - name: triton.log file: /tmp/triton.log attributes: logtype: triton_logsRestart the New Relic infrastructure agent
Run this command to restart your infrastructure agent:
$sudo systemctl restart newrelic-infra.serviceIn a couple of minutes, your NVIDIA Triton server will send metrics to one.newrelic.com.
Find your data
You can choose our pre-built dashboard template named NVIDIA Triton to monitor your NVIDIA Triton server metrics. Follow these steps to use our pre-built dashboard template:
Go to one.newrelic.com > Integrations & Agents and type NVIDIA Triton.
Under Dashboards, click NVIDIA Triton.
Click Edit if you want to change the account in the open popup window.
Click Setup NVIDIA Triton or Skip this step if you already setup this datasource.
Click View dashboard, and see your NVIDIA Triton data in New Relic.
You can find your custom NVIDIA Triton dashboard in the Dashboards UI. See our dashboard section for more information.
Here is a NRQL query to check the NVIDIA Triton CPU memory:
SELECT latest(nv_cpu_memory_total_bytes) / 1e+6 AS 'memory (MB)' FROM Metric
What's next?
To learn more about building NRQL queries and generating dashboards, check out these docs:
- Introduction to the query builder to create basic and advanced queries.
- Introduction to dashboards to customize your dashboard and carry out different actions.
- Manage your dashboard to adjust kkukkyour dashboards display mode, or to add more content to your dashboard.