Monitor Apache Mesos clusters seamlessly with New Relic for comprehensive insights into performance, health, and resource utilization. Track master and slave nodes, monitor task execution, and review system metrics.

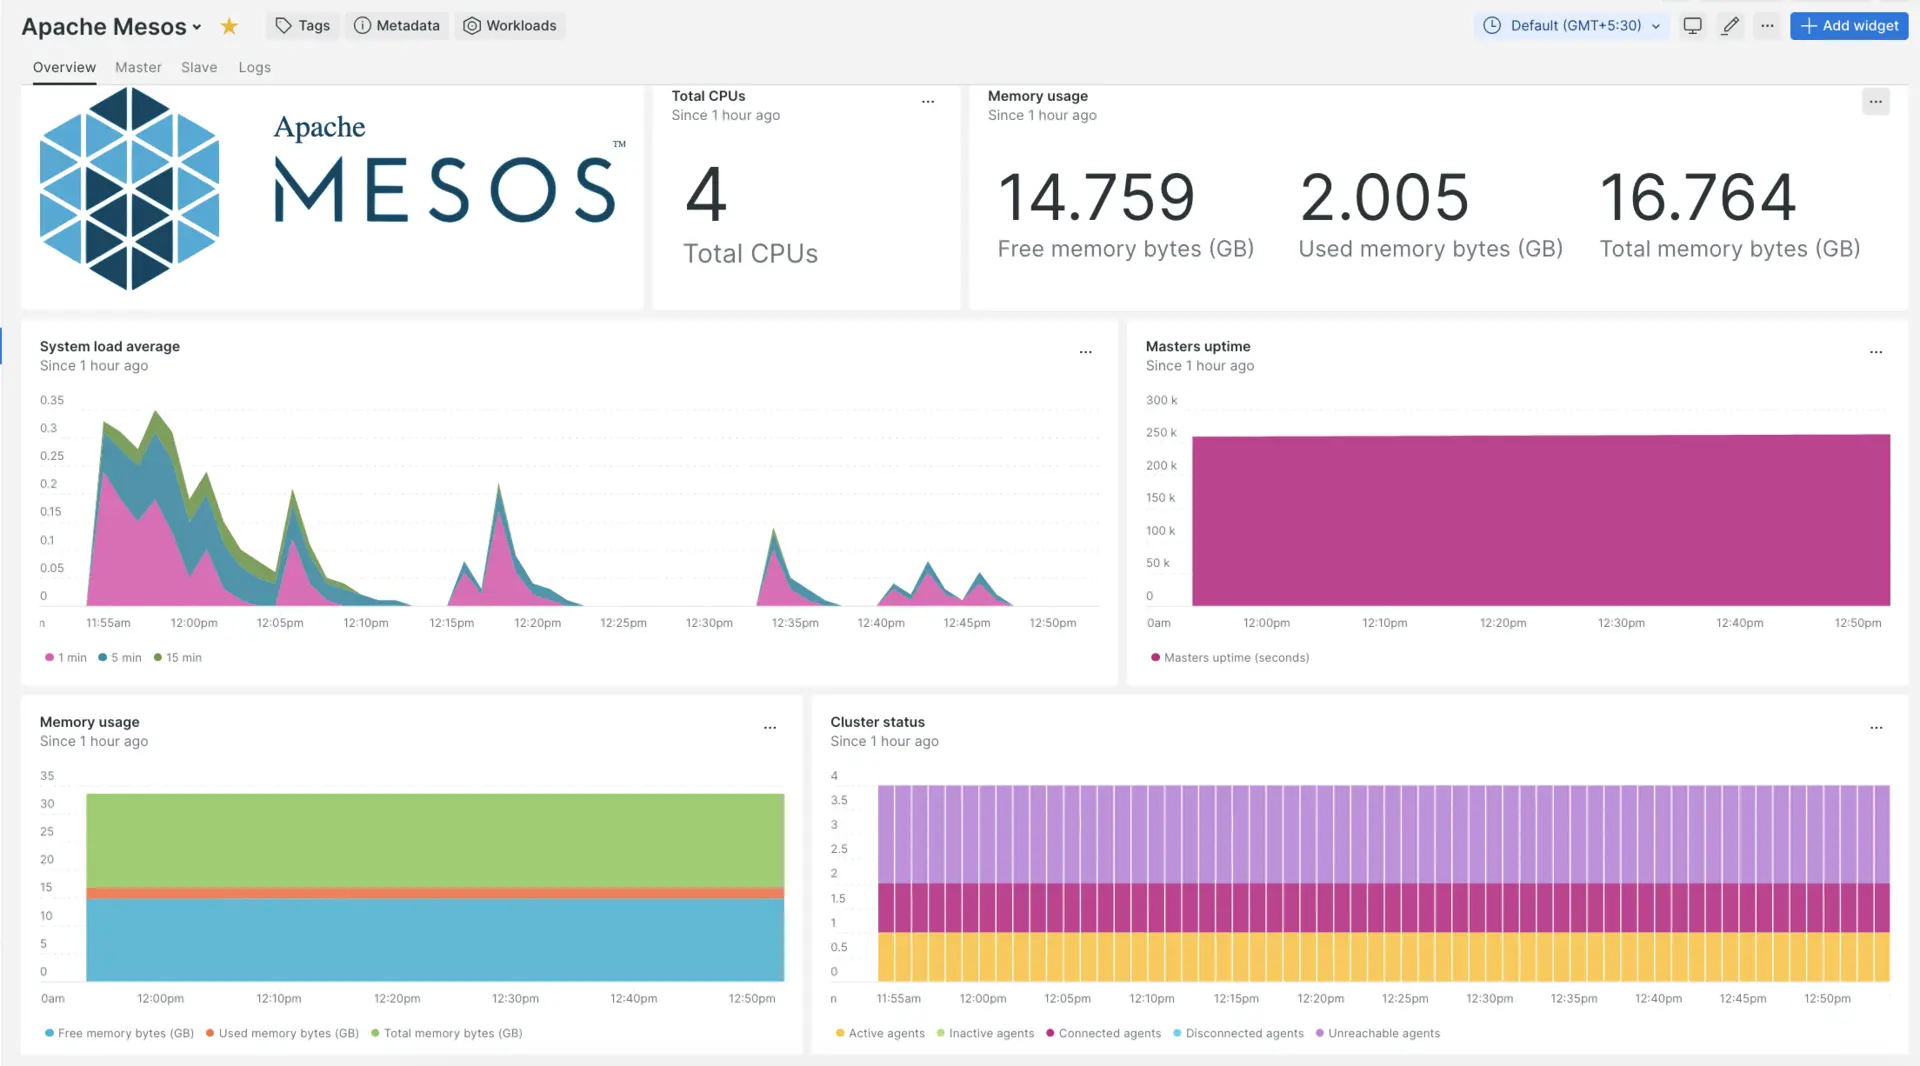
After setting up our Apache Mesos integration, we give you a dashboard for your Apache Mesos metrics.
Install the infrastructure agent
To use the Apache Mesos integration, you need to also install the infrastructure agent on the same host. The infrastructure agent monitors the host itself, while the integration you'll install in the next step extends your monitoring with Apache Mesos-specific data.
Enable the Apache Mesos integration with nri-flex
To set up the Apache Mesos integration, follow these steps:
Create a file named
nri-apache-mesos-config.ymlin the integrations directory:bash$touch /etc/newrelic-infra/integrations.d/nri-apache-mesos-config.ymlAdd the following snippet to your
nri-apache-mesos-config.ymlfile to enable the agent to capture Apache Mesos data:integrations:- name: nri-flexinterval: 30sconfig:name: apacheMesosapis:- event_type: apacheMesosurl: http://<ip-address>:5050/metrics/snapshot
Forward Apache Mesos logs
Follow these steps to forward Apache Mesos logs to New Relic:
Edit the log file named
logging.ymllocated at the following path:bash$cd /etc/newrelic-infra/logging.dAdd the following snippet to the
logging.ymlfile. Replacefilewith your Apache Mesos log filepath if needed:logs:- name: apache-mesos.logfile: /var/log/mesos/LOG_FILE_NAMEattributes:logtype: apache_mesos_log
Restart the New Relic infrastructure agent
Restart your infrastructure agent:
$sudo systemctl restart newrelic-infra.serviceIn a couple of minutes, your application will begin sending metrics to one.newrelic.com.
Find your data
You can use our pre-built dashboard template to monitor your Apache Mesos application metrics. Follow these steps to use our pre-built dashboard template:
From one.newrelic.com, go to the + Integrations & Agents page
Click on Dashboards
In the search bar, type
Apache MesosThe Apache Mesos dashboard should appear. Click on it to install it
Your Apache Mesos dashboard is considered a custom dashboard and can be found in the Dashboards UI. For docs on using and editing dashboards, see our dashboard docs.
Here is an example NRQL query to view the Apache Mesos master uptime:
SELECT latest(`master/uptime_secs`) as 'Masters uptime (seconds)' FROM apacheMesos
What's next?
To learn more about building NRQL queries and generating dashboards, check out these docs:
- Introduction to the query builder to create basic and advanced queries.
- Introduction to dashboards to customize your dashboard and carry out different actions.
- Manage your dashboard to adjust your dashboards display mode, or to add more content to your dashboard.