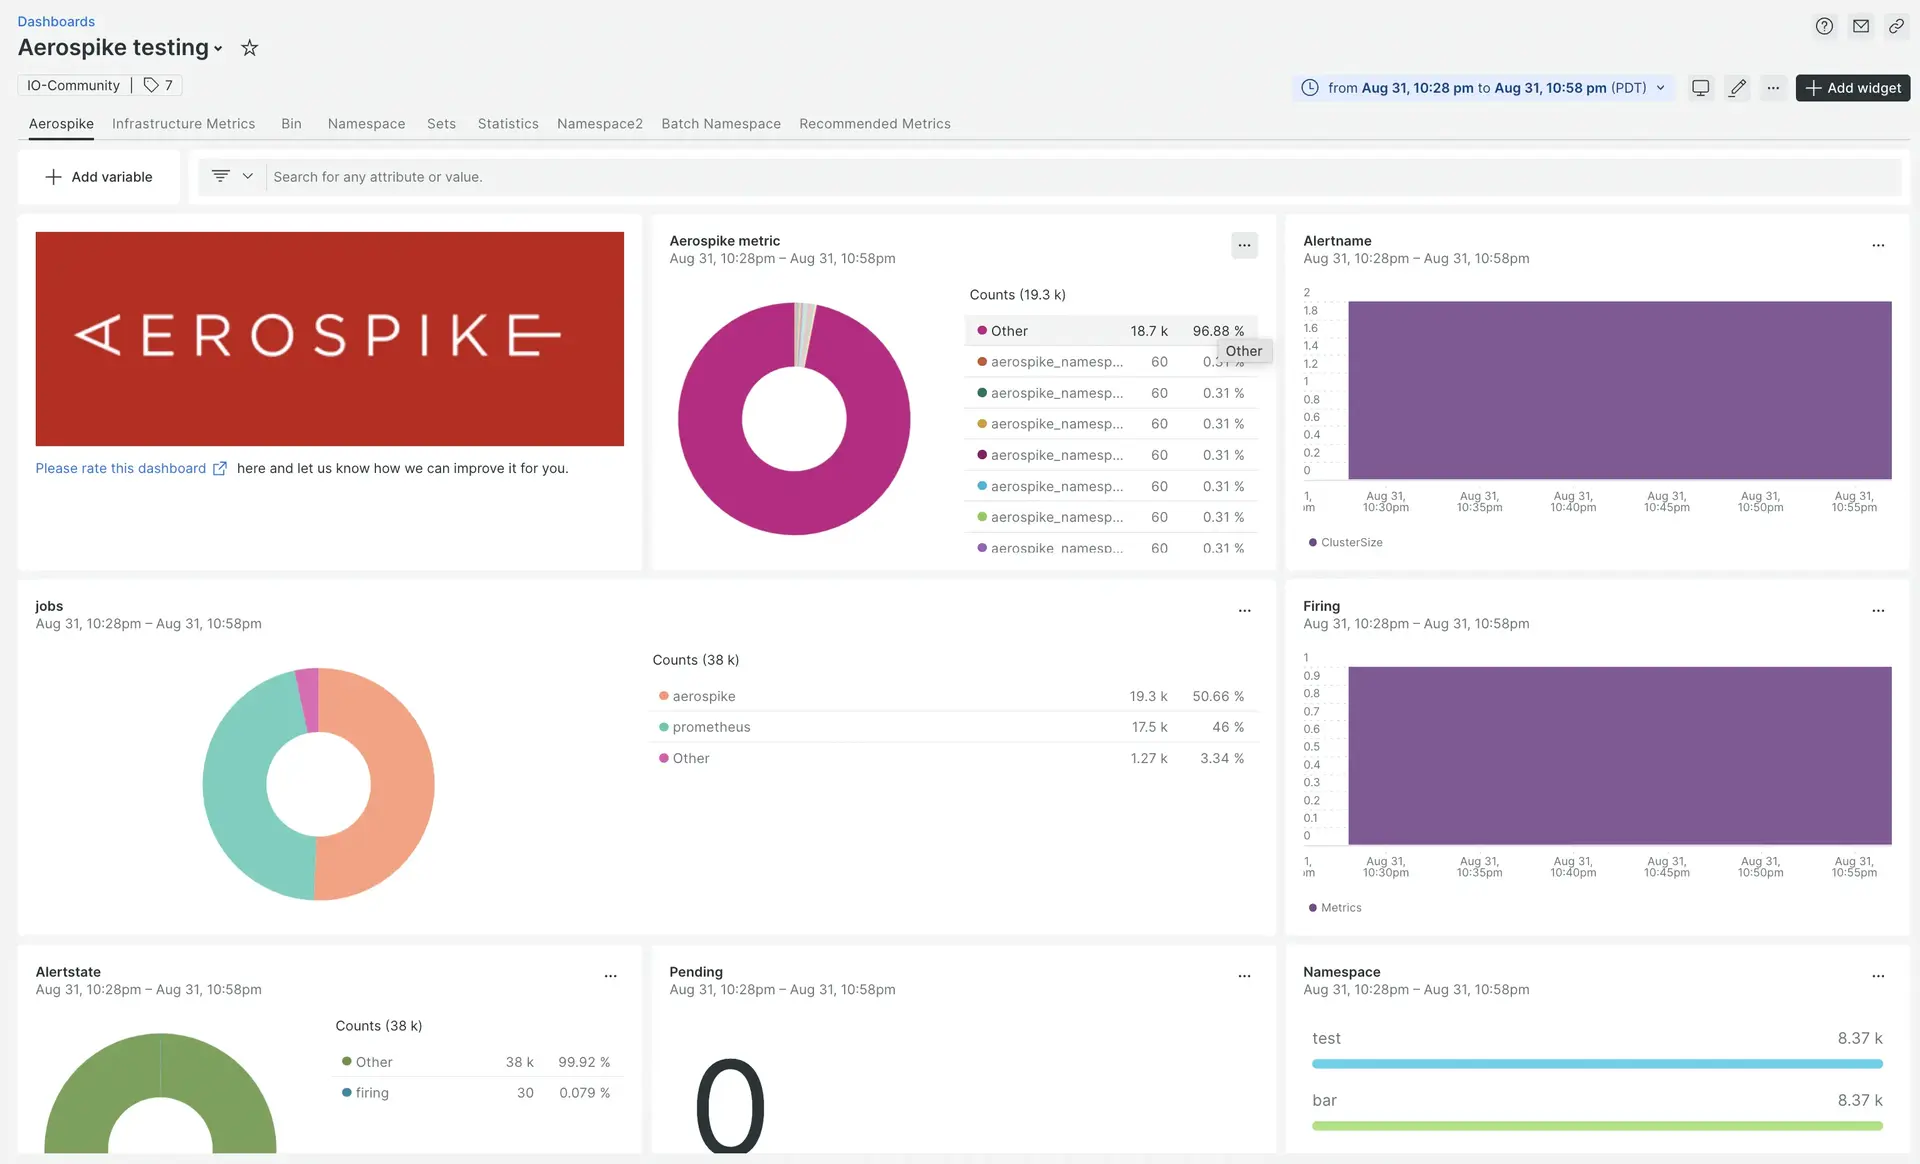
Our Aerospike integration monitors the performance of your Aerospike data platform, helping you diagnose issues in your application and optimize your code. Our Aerospike integration gives you a pre-built dashboard with your most important Aerospike app metrics.

After setting up the integration with New Relic, see your data in dashboards like these, right out of the box.
Install the infrastructure agent
To use the Aerospike integration, you need to first install the infrastructure agent on the same host. The infrastructure agent monitors the host itself, while the integration you'll install in the next step extends your monitoring with Aerospike-specific data.
Install Aerospike integration
To install nri-aerospike, use the following command:
bash$sudo apt-get install nri-aerospikeVerify
nri-aerospikewas successfully installed by:- Checking that Exporter is installed in the
/var/db/newrelic-infra/newrelic-integrations/bindirectory. - Checking for a configuration file in the
/etc/newrelic-infra/integrations.ddirectory
- Checking that Exporter is installed in the
Configure the integration:
Rename the sample configuration file from
aerospike-config.yml.sampletoaerospike-config.yml:bash$sudo cp aerospike-config.yml.sample aerospike-config.ymlEdit the config file as needed. The following is as basic example of a configuration file:
integrations:- name: nri-aerospikeconfig:# API URL of the aerospike serviceaerospike_db_host: localhostaerospike_db_port: 3000# Port to expose scrape endpoint on, If this is not provided a random port will be used to launch the exporterexporter_port: 9145# Cluster name is used on the aerospike.prometheus.json.template -# all the metrics captured by nri-prometheus will be categorized under this cluster nameaerospike_cluster_name: YOUR_DESIRED_CLUSTER_NAMEscrape_timeout: 5slabel_type: developmentlabel_source: aerospikeexporter_files_path: /tmpAfter you've successfully configured
nri-aerospike, you can see the list of monitored Aerospike metrics inhttp://localhost:9145/metrics.
Find your data
To get your Aerospike dashboard:
From one.newrelic.com, go to the Integrations & Agents page.
Click on Dashboards.
In the search bar, type
Aerospike.The Aerospike dashboard should appear. Click on it to install it.
Your Aerospike dashboard is considered a custom dashboard and can be found in the Dashboards UI. For docs on using and editing dashboards, see our dashboard docs.
This integration reports data in the form of our infrastructure agent.
Here's an example NRQL query checking the percentage of memory capacity free on the namespace:
FROM MetricSELECT latest (aerospike_namespace_memory_free_pct)
What's next?
To learn more about querying your data and creating custom dashboards, check out these docs: