Our port monitoring integration monitors status for networking ports, such as TCP, UDP, etc., and reports uptime and outage data to New Relic.

Tip
This integration is released as open source on Github. A change log is also available there for the latest updates.
Install the integration
Follow the steps below to install the integration:
Install the infrastructure agent
To use the Port Monitoring integration, you need to first install the infrastructure agent on the same host. All our on-host integrations require the infrastructure agent, which helps expose and report metrics to New Relic.
Download and prepare the integration
Choose and download a release for your platform from the GitHub repo. For example:
bash$wget https://github.com/newrelic/nri-port-monitor/releases/download/1.4/nri-port-monitor_x86_64.tar.gz && tar -zxvf nri-port-monitor_x86_64.tar.gzCopy
nri-port-monitorexecutable to/var/db/newrelic-infra/newrelic-integrations. Copyport-monitor-config.ymlto/etc/newrelic-infra/integrations.dbash$cp nri-port-monitor /var/db/newrelic-infra/newrelic-integrations && cp port-monitor-config.yml /etc/newrelic-infra/integrations.dSet execution permissions for the binary file
nri-port-monitorso it can run correctly:bash$chmod +x /var/db/newrelic-infra/newrelic-integrations/nri-port-monitor
Configure the integration
Open
port-monitor-config.ymland edit the config with all the port instances you'd like to monitor (add multiple stanzas to integrations block for each address/port to monitor:integrations:- name: nri-port-monitorinterval: 60senv:# Network type. Known networks are:# tcp, tcp4 (IPv4-only), tcp6 (IPv6-only),# udp, udp4 (IPv4-only), udp6 (IPv6-only),# ip, ip4 (IPv4-only), ip6 (IPv6-only),# unix, unixgram and unixpacketNETWORK: tcp# Address to check in the format host:portADDRESS: localhost:80# Timeout in secondsTIMEOUT: 5labels:env: production
Find your data
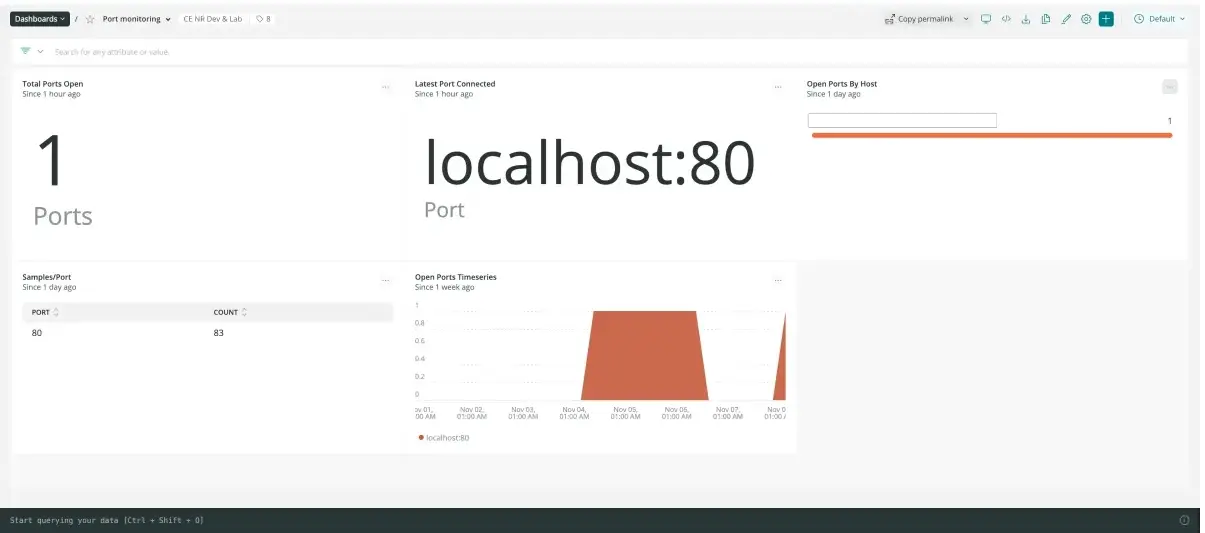
To easily find your Port Monitoring data, download our pre-built dashboard:
Go to one.newrelic.com and click on + Integrations & Agents.
Click on Dashboards tab.
In the search box, search for Port Monitoring.
Click on the Port Monitoring dashboard to install it.
Here's an example NRQL query that returns the status of configured ports:
SELECT latest(status) FROM NetworkPortSample FACET address SINCE 30 MINUTES AGO TIMESERIES