Our Linkerd integration is a service mesh for Kubernetes. It makes running services easier and safer by giving you runtime debugging, observability, reliability, and security—all without requiring any changes to your code.

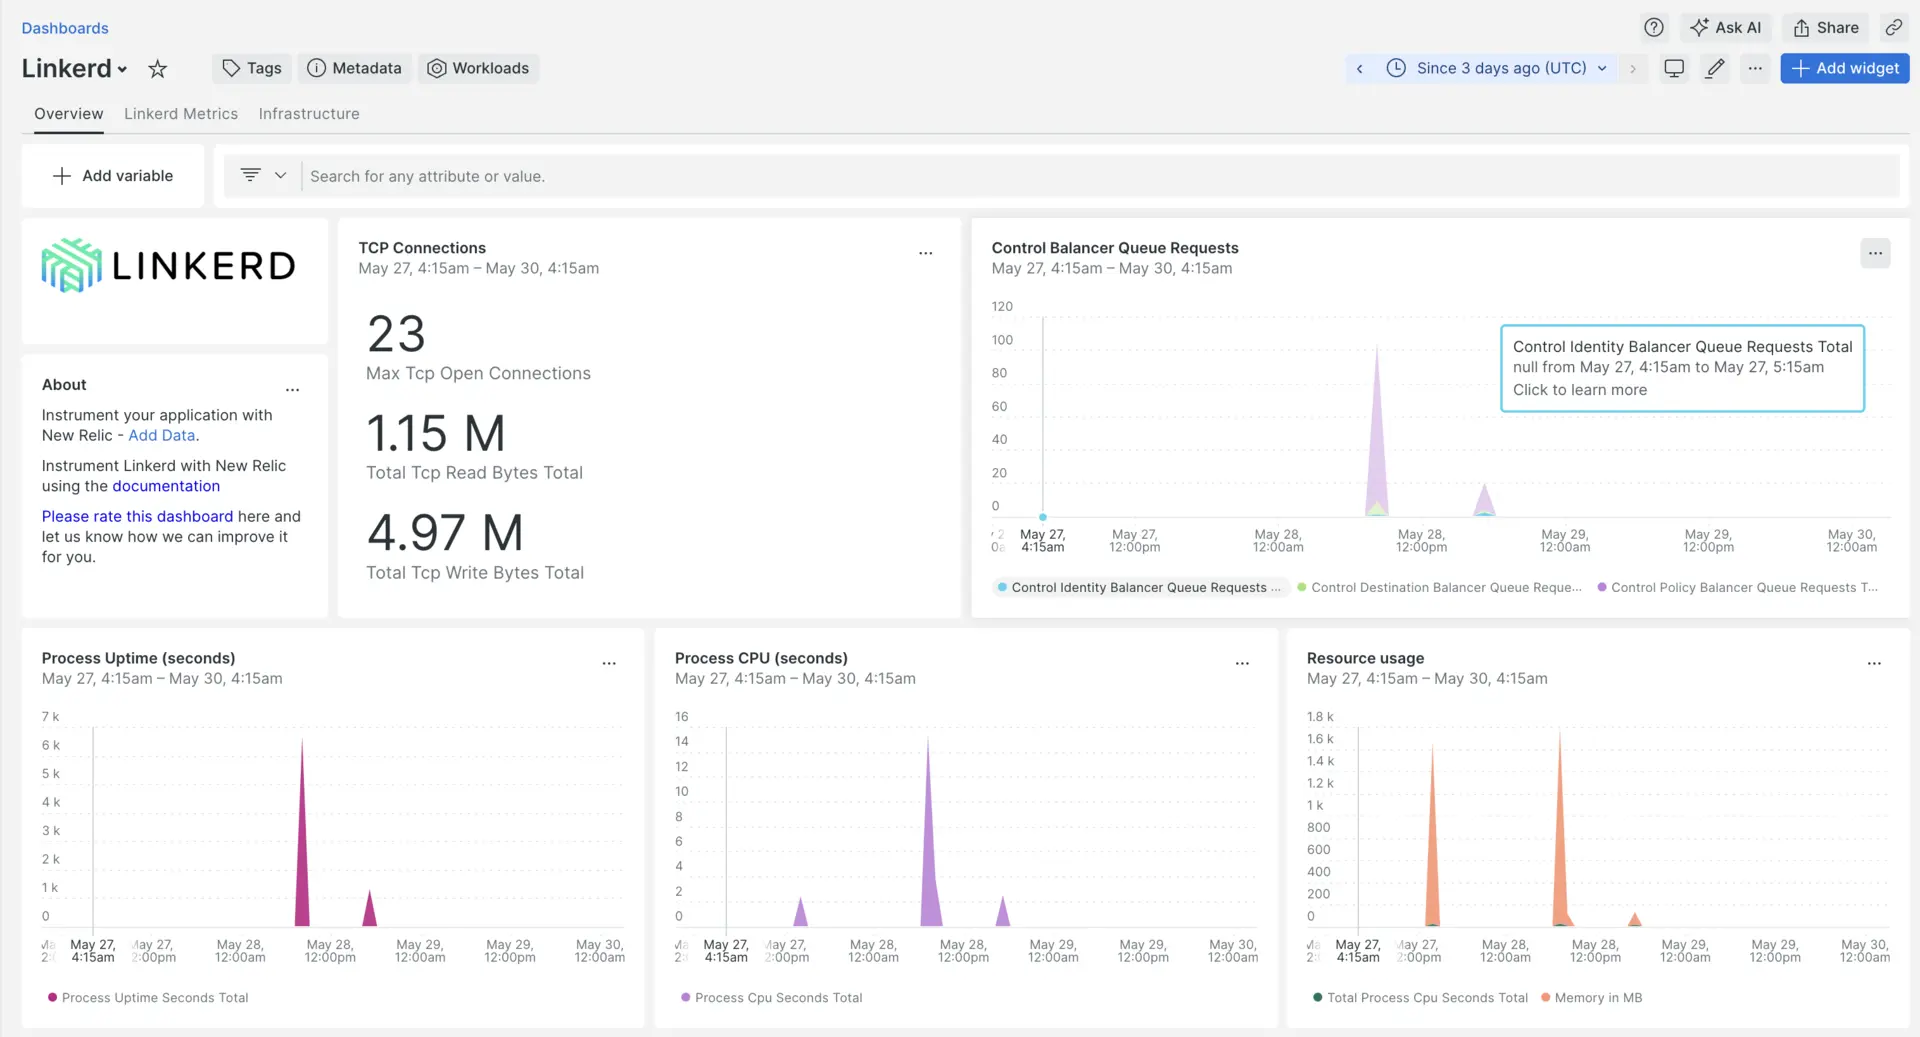
After setting up our Linkerd integration, you'll see a dashboard for your Linkerd metrics.
Install the infrastructure agent
To use the Linkerd integration, you need to also install the infrastructure agent on the same host. The infrastructure agent monitors the host itself, while the integration you'll install in the next step extends your monitoring with Linkerd-specific data.
Expose Linkerd metrics
Use the following script to check all Linkerd pods:
bash$kubectl get pods -n <LINKERD_NAMESPACE>- Replace
LINKERD_NAMESPACEwith the actual namespace where your Linkerd pods are running.
- Replace
Next, make sure to send all metrics to Port 4191 for each Linkerd Pod:
bash$kubectl port-forward --address 0.0.0.0 -n <LINKERD_NAMESPACE> <LINKERD_POD_NAME> 4191:4191 &- Replace
LINKERD_NAMESPACEwith the actual namespace where your Linkerd pods are running andLINKERD_POD_NAMEwith the actual name of each Linkerd pod.
- Replace
Enable the Linkerd integration with nri-prometheus
To set up the Linkerd integration, follow these steps:
Create a file named
nri-prometheus-config.ymlin the integrations directory:bash$touch /etc/newrelic-infra/integrations.d/nri-prometheus-config.ymlAdd the following snippet to your
nri-prometheus-config.ymlfile to enable the agent to capture Linkerd data:integrations:- name: nri-prometheusconfig:# When standalone is set to false nri-prometheus requires an infrastructure agent to work and send data. Defaults to truestandalone: false# When running with infrastructure agent emitters will have to include infra-sdkemitters: infra-sdk# The name of your cluster. It's important to match other New Relic products to relate the data.cluster_name: "YOUR_DESIRED_CLUSTER_NAME"targets:- description: Linkerd metrics listurls: ["http://<ip-address>:4191/metrics","http://<ip-address>:9090/metrics"]# tls_config:# ca_file_path: "/etc/etcd/etcd-client-ca.crt"# cert_file_path: "/etc/etcd/etcd-client.crt"# key_file_path: "/etc/etcd/etcd-client.key"# Whether the integration should run in verbose mode or not. Defaults to falseverbose: false# Whether the integration should run in audit mode or not. Defaults to false.# Audit mode logs the uncompressed data sent to New Relic. Use this to log all data sent.# It does not include verbose mode. This can lead to a high log volume, use with careaudit: false# The HTTP client timeout when fetching data from endpoints. Defaults to 30s.# scrape_timeout: "30s"# Length in time to distribute the scraping from the endpointsscrape_duration: "5s"# Number of worker threads used for scraping targets.# For large clusters with many (>400) endpoints, slowly increase until scrape# time falls between the desired `scrape_duration`.# Increasing this value too much will result in huge memory consumption if too# many metrics are being scraped.# Default: 4# worker_threads: 4# Whether the integration should skip TLS verification or not. Defaults to falseinsecure_skip_verify: truetimeout: 10s
Restart the New Relic infrastructure agent
Restart your infrastructure agent.
$sudo systemctl restart newrelic-infra.serviceIn a couple of minutes, your application will send metrics to one.newrelic.com.
Find your data
You can choose our pre-built dashboard template named Linkerd to monitor your Linkerd application metrics. Follow these steps to use our pre-built dashboard template:
From one.newrelic.com, go to the + Integrations & Agents page.
Click on Dashboards.
In the search bar, type
Linkerd.When the Linkerd dashboard option appears, click to install it.
Your Linkerd dashboard is considered a custom dashboard and can be found in the Dashboards UI. For docs on using and editing dashboards, see our dashboard docs.
Here is a NRQL query to check the Linkerd downstream total connections:
SELECT latest(process_virtual_memory_bytes)/(1024*1024) as 'Memory in MB' FROM Metric
What's next?
To learn more about building NRQL queries and generating dashboards, check out these docs:
- Introduction to the query builder to create basic and advanced queries.
- Introduction to dashboards to customize your dashboard and carry out different actions.
- Manage your dashboard to adjust your dashboards display mode, or to add more content to your dashboard.