Our Apache Hadoop integration monitors the performance of your Hadoop cluster and applications. The integration provides an in-depth understanding of Apache Hadoop performance and health by providing data about your HDFS (Hadoop Distributed File System), blocks, system load, data nodes, NodeManager, and jobs.

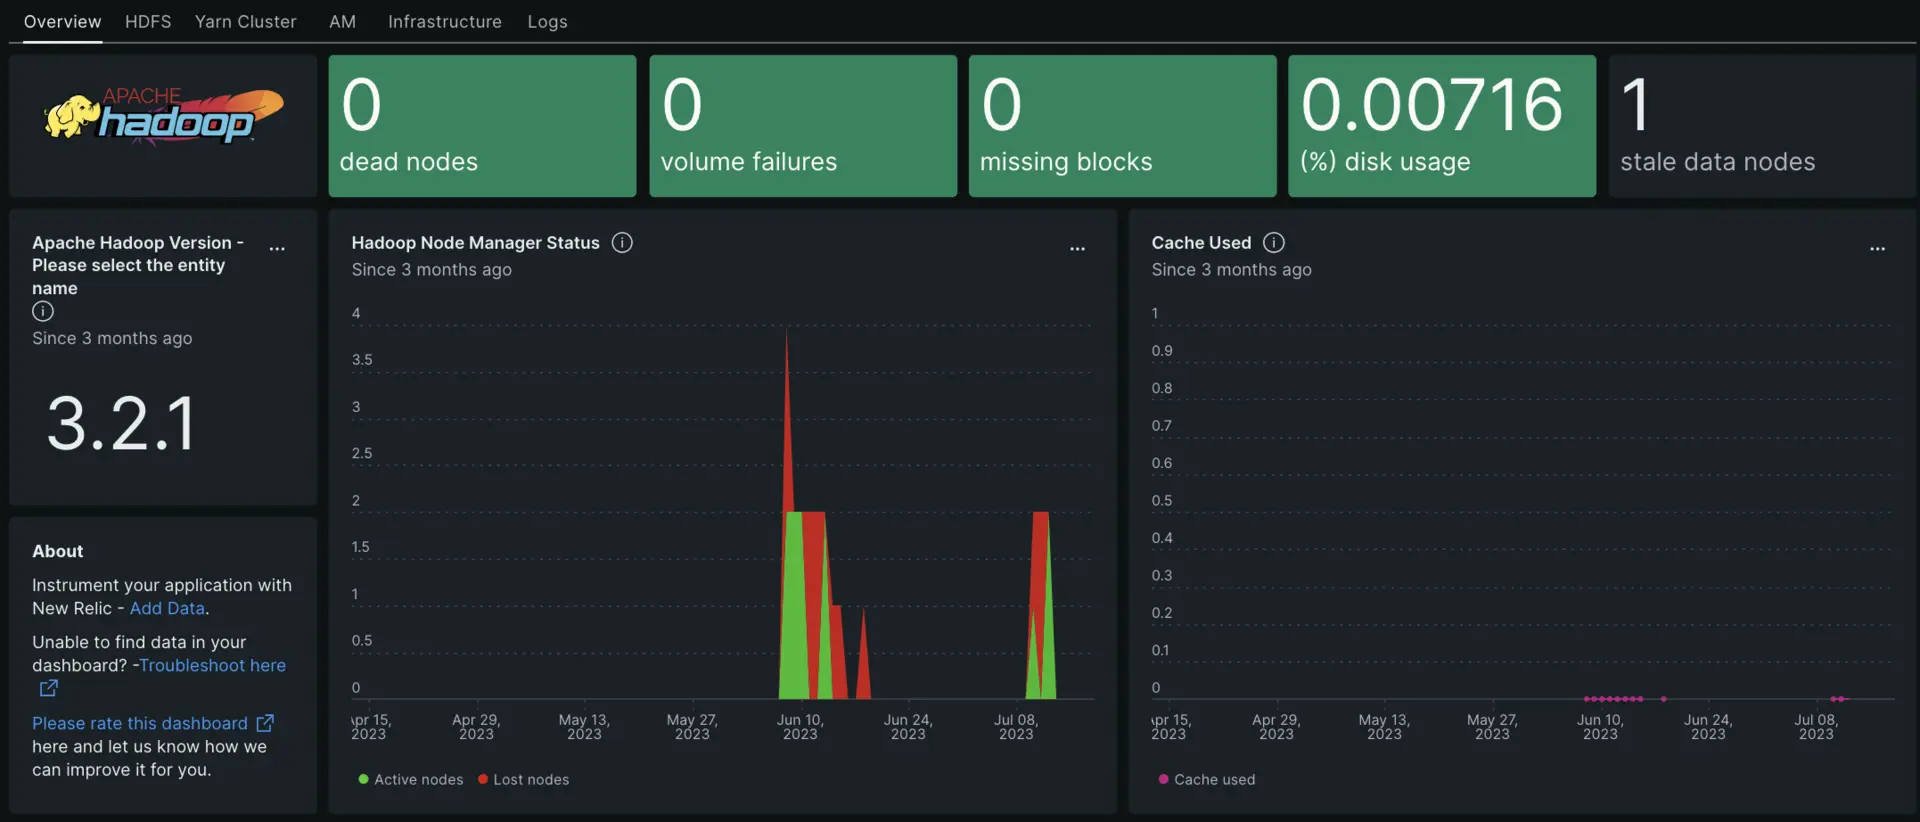
After setting up our Apache Hadoop, we give you a dashboard for your Apache Hadoop metrics.
Complete the following steps to install the integration:
Install the infrastructure agent
To use the Apache Hadoop integration, you need to first install the infrastructure agent on the same host. The infrastructure agent monitors the host itself, while the integration you'll install in the next step extends your monitoring with Hadoop-specific data.
Configure NRI-Flex for Apache Hadoop
Our flex integration comes bundled with the New Relic infrastructure agent and is used to send your Apache Hadoop data to New Relic. To create a flex configuration file follow these steps:
Create a file named
nri-flex-hadoop-config.ymlin the/etc/newrelic-infra/integrations.dpath.Use our configuration template to update the fields
EVENT_TYPEandYOUR_DOMAINin the created file namednri-flex-hadoop-config.yml. The value on theevent_typeis used to store metrics on the NRDB.Example:
EVENT_TYPE1can be updated toHadoopResourceManagerSampleEVENT_TYPE2can be updated toHadoopNameNodeSample
Your
nri-flex-hadoop-config.ymlfile should look like this:integrations:- name: nri-flex# interval: 30sconfig:name: hadoopMetricsapis:- event_type: EVENT_TYPE1commands:# run any command, you could cat .json file, or run some commands that produce a json output# the example just calls an API that returns json- run: curl -s https://YOUR_DOMAIN:9870/jmx #json output is retrieved from this command- event_type: EVENT_TYPE2commands:- run: curl -s https://YOUR_DOMAIN:8088/jmx?qry=Hadoop:*
Forward Apache Hadoop logs to New Relic
You can use our log forwarding to forward Apache Hadoop logs to New Relic.
Create a log file named
logging.ymlin/etc/newrelic-infra/logging.d/After creating the log file, add the following script to the
logging.ymlfile:logs:- name: hadoop_secondarynamenode_logfile: /usr/local/hadoop/logs/hadoop-hadoopuser-secondarynamenode-hadoop-master.logattributes:logtype: hadoop_secondarynamenode_logs- name: hadoop_resourcemanager_logfile: /usr/local/hadoop/logs/hadoop-hadoopuser-resourcemanager-hadoop-master.logattributes:logtype: hadoop_hadoop_resourcemanager_logs- name: hadoop_namenode_logfile: /usr/local/hadoop/logs/hadoop-hadoopuser-namenode-hadoop-master.logattributes:logtype: hadoop_namenode_logs
Restart the New Relic infrastructure agent
Before you can start using your data, restart your infrastructure agent.
The following command should work for most systems:
$sudo systemctl restart newrelic-infra.serviceFind your data
You can choose our pre-built dashboard template named Apache Hadoop to monitor your Apache Hadoop server metrics. Follow these steps to use our pre-built dashboard template:
From one.newrelic.com, go to the + Integrations & Agents page.
Click on Dashboards.
In the search bar, type
apache hadoop.The Apache Hadoop dashboard should appear. Click on it to install it.
Your Apache Hadoop dashboard is considered a custom dashboard and can be found in the Dashboards UI. For docs on using and editing dashboards, see our dashboard docs.
Here is a NRQL query to check the active users from the resource manager:
SELECT latest(activeUsers)FROM HadoopResourceManagerSampleHere is a NRQL query to view the number of active clients from the name node:
SELECT latest(numActiveClients)FROM HadoopNameNodeSample
What's next?
To learn more about building NRQL queries and generating dashboards, check out these docs:
- Introduction to the query builder to create basic and advanced queries.
- Introduction to dashboards to customize your dashboard and carry out different actions.
- Manage your dashboard to adjust your dashboards display mode, or to add more content to your dashboard.