Integrating Apache Druid with New Relic enhances your ability to monitor, analyze, and optimize the performance of your Druid clusters. The Apache Druid integration provides powerful monitoring and alerting features so you can ensure the reliability and efficiency of your Druid-based analytics platform.

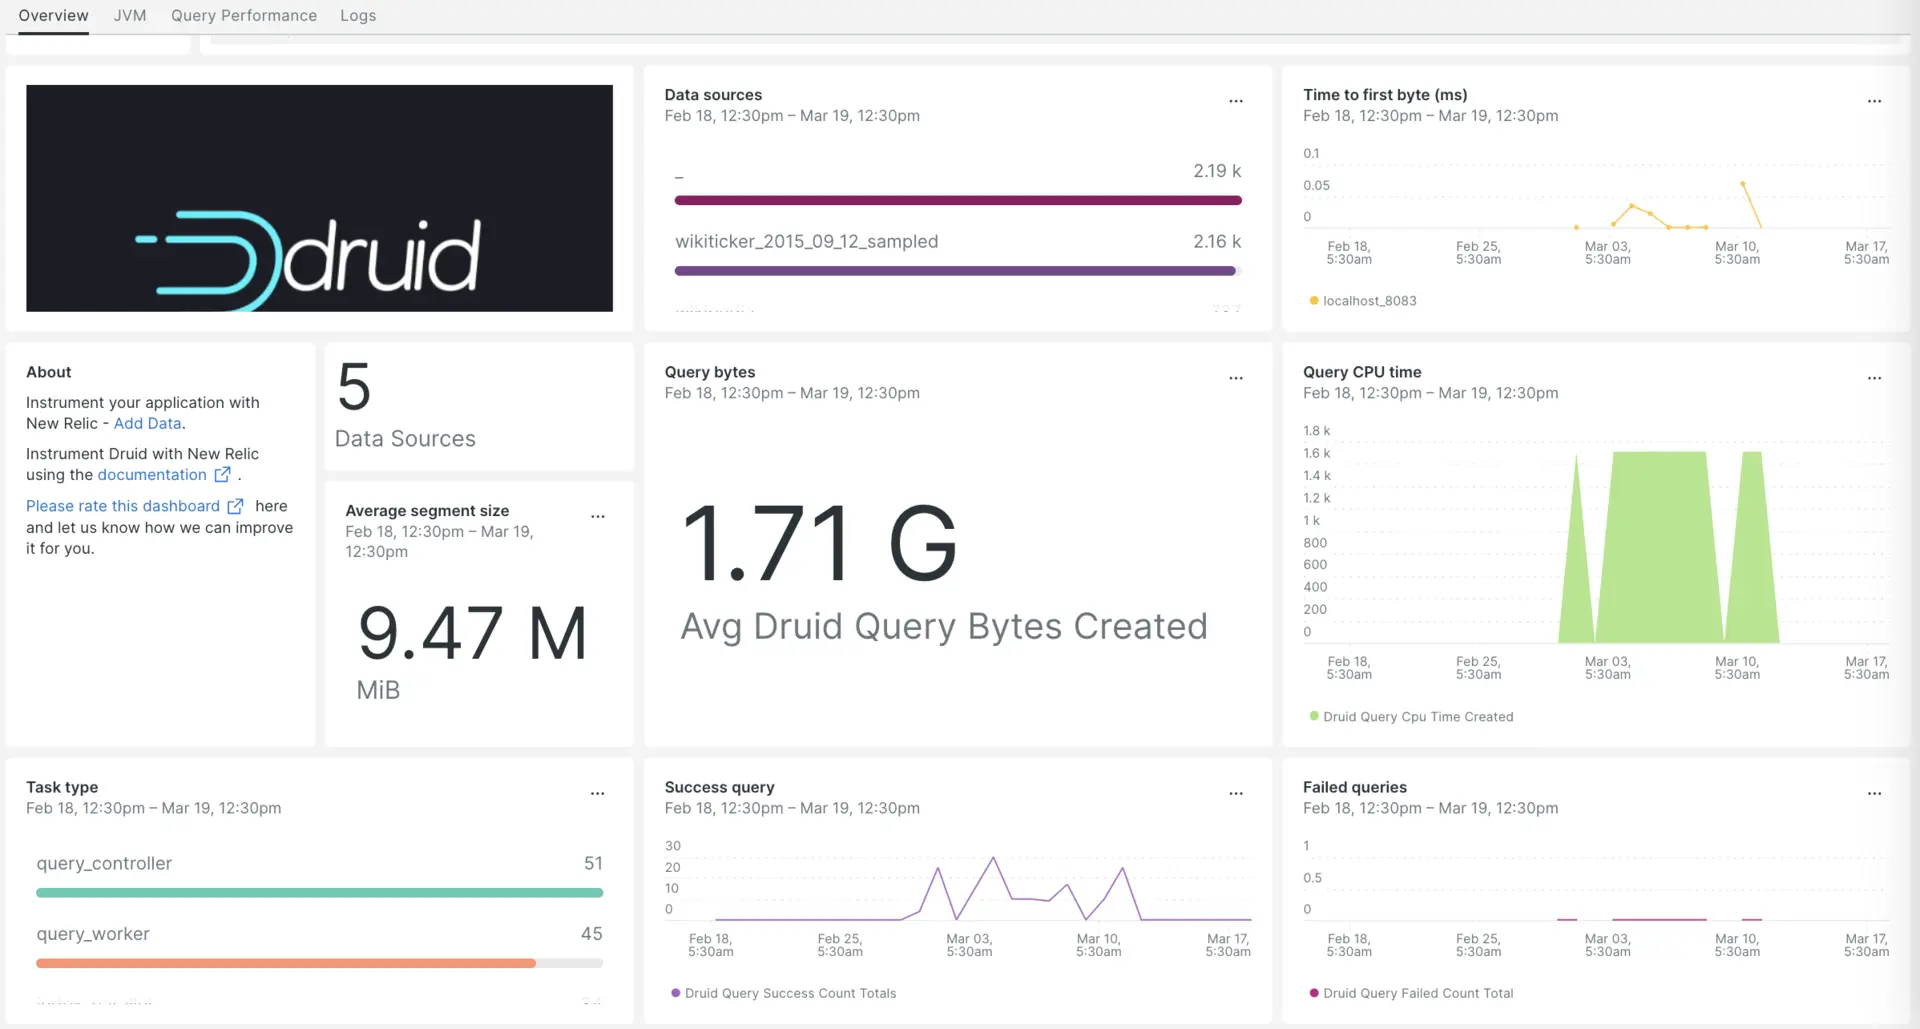
After setting up the Apache Druid integration with New Relic, see your data in a dashboard right out of the box.
Set up the Apache Druid integration
Complete the following steps to set up the Apache Druid integration:
Install the infrastructure agent
To use the Apache Druid integration, you need to first install the infrastructure agent on the same host. The infrastructure agent monitors the host itself, while the Apache Druid integration extends your monitoring with data specific to your Druid clusters.
Expose Druid metrics using Prometheus Emitter
Add
prometheus.emitterto the end of the extensions load list in yourapache-druid-$version/conf/druid/single-server/micro-quickstart/_common/common.runtime.propertiesfile:druid.extensions.loadList=["druid-hdfs-storage", "druid-kafka-indexing-service", "druid-datasketches", "druid-multi-stage-query", "prometheus-emitter"]In the file paths listed in the left column, add the code snippets listed in the right columns.
Filepath
Code snippet
PATH/TO/broker/runtime.properties# Monitoringdruid.monitoring.monitors=["org.apache.druid.java.util.metrics.JvmMonitor"]druid.emitter=prometheusdruid.emitter.logging.logLevel=infodruid.emitter.prometheus.strategy=exporterdruid.emitter.prometheus.port=19091PATH/TO/coordinator-overlord/runtime.properties# Monitoringdruid.monitoring.monitors=["org.apache.druid.java.util.metrics.JvmMonitor"]druid.emitter=prometheusdruid.emitter.logging.logLevel=infodruid.emitter.prometheus.strategy=exporterdruid.emitter.prometheus.port=19092PATH/TO/historical/runtime.properties# Monitoringdruid.monitoring.monitors=["org.apache.druid.java.util.metrics.JvmMonitor"]druid.emitter=prometheusdruid.emitter.logging.logLevel=infodruid.emitter.prometheus.strategy=exporterdruid.emitter.prometheus.port=19093PATH/TO/middleManager/runtime.properties# Monitoringdruid.monitoring.monitors=["org.apache.druid.java.util.metrics.JvmMonitor"]druid.emitter=prometheusdruid.emitter.logging.logLevel=infodruid.emitter.prometheus.strategy=exporterdruid.emitter.prometheus.port=19094PATH/TO/router/runtime.properties# Monitoringdruid.monitoring.monitors=["org.apache.druid.java.util.metrics.JvmMonitor"]druid.emitter=prometheusdruid.emitter.logging.logLevel=infodruid.emitter.prometheus.strategy=exporterdruid.emitter.prometheus.port=19095
Install the Prometheus Emitter Extension
- Run the following commands to create a folder named
prometheus-emitterwithin theextensionsfolder directory of your Apache Druid setup:bash$cd apache-druid-$version/extensions/bash$sudo mkdir prometheus-emitter - Navigate to the druid download directory and run the following command to create jar files that the server calls on start up:bash$sudo java \>-cp "lib/*" \>-Ddruid.extensions.directory="extensions" \>-Ddruid.extensions.hadoopDependenciesDir="hadoop-dependencies" \>org.apache.druid.cli.Main tools pull-deps \>--no-default-hadoop \>-c "org.apache.druid.extensions.contrib:prometheus-emitter:24.0.0"
Configure nri-prometheus for Apache Druid
Create a file named
nri-prometheus-config.yml:bash$touch /etc/newrelic-infra/integrations.d/nri-prometheus-config.ymlAdd the following snippet to your
nri-prometheus-config.ymlfile to enable the capture of Apache Druid data:integrations:- name: nri-prometheusconfig:# When standalone is set to false nri-prometheus requires an infrastructure agent to work and send data. Defaults to truestandalone: false# When running with infrastructure agent emitters will have to include infra-sdkemitters: infra-sdk# The name of your cluster. It's important to match other New Relic products to relate the data.cluster_name: "Apache-druid"targets:- description: Secure etcd exampleurls: ["http://<YOUR_HOST_IP>:19091/metrics","http://<YOUR_HOST_IP>:19092/metrics", "http://<YOUR_HOST_IP>:19093/metrics","http://<YOUR_HOST_IP>:19094/metrics","http://<YOUR_HOST_IP>:19095/metrics"]# tls_config:# ca_file_path: "/etc/etcd/etcd-client-ca.crt"# cert_file_path: "/etc/etcd/etcd-client.crt"# key_file_path: "/etc/etcd/etcd-client.key"# Whether the integration should run in verbose mode or not. Defaults to false.verbose: false# Whether the integration should run in audit mode or not. Defaults to false.# Audit mode logs the uncompressed data sent to New Relic. Use this to log all data sent.# It does not include verbose mode. This can lead to a high log volume, use with care.audit: false# The HTTP client timeout when fetching data from endpoints. Defaults to "5s" if it is not set.# This timeout in seconds is passed as well as a X-Prometheus-Scrape-Timeout-Seconds header to the exporters# scrape_timeout: "5s"# Length in time to distribute the scraping from the endpoints. Default to "30s" if it is not set.scrape_duration: "5s"# Number of worker threads used for scraping targets.# For large clusters with many (>400) endpoints, slowly increase until scrape# time falls between the desired `scrape_duration`.# Increasing this value too much will result in huge memory consumption if too# many metrics are being scraped.# Default: 4# worker_threads: 4# Whether the integration should skip TLS verification or not. Defaults to false.insecure_skip_verify: falsetimeout: 10s
Forward Druid logs to New Relic
Edit the log file named
logging.ymllocated at the following path:bash$cd /etc/newrelic-infra/logging.dAdd the following snippet to the
logging.ymlfile:- name: druid-logsfile: /home/<Druid-Download Directory>/log/*.logattributes:logtype: apache-druid
Restart the infrastructure agent
Use the instructions in our infrastructure agent docs to restart your infrastructure agent. This is a basic command that should work for most people:
$sudo systemctl restart newrelic-infra.serviceView your Druid metrics in New Relic
Once you've completed the setup above, you can view your metrics using our pre-built dashboard template. To access this dashboard:
Go to one.newrelic.com > + Integrations & Agents.
Click on the Dashboards tab.
In the search box, type
Apache druid.Select it and click Install.
To instrument the Apache Druid quickstart and to see metrics and alerts, you can also follow our Apache Druid quickstart page by clicking on the
Install nowbutton.Here's an example query to check the average Druid segment size:
SELECT average(druid_segment_size) AS 'MiB' FROM Metric SINCE 30 MINUTES AGO
What's next?
To learn more about building NRQL queries and generating dashboards, check out these docs:
- Introduction to the query builder to create basic and advanced queries.
- Introduction to dashboards to customize your dashboard and carry out different actions.
- Manage your dashboard to adjust your display mode, or to add more content to your dashboard.