Welcome to the New Relic observability platform! Our platform gives you deep visibility into your systems. It helps you solve problems you may not have been aware of, regardless of the technology you use. You can see how New Relic works here or get started now if you want to jump right in.
New Relic provides many ways to increase visibility. This allows you to monitor, troubleshoot, and improve digital performance. Here's a brief overview of our most popular capabilities and features.
Alerts
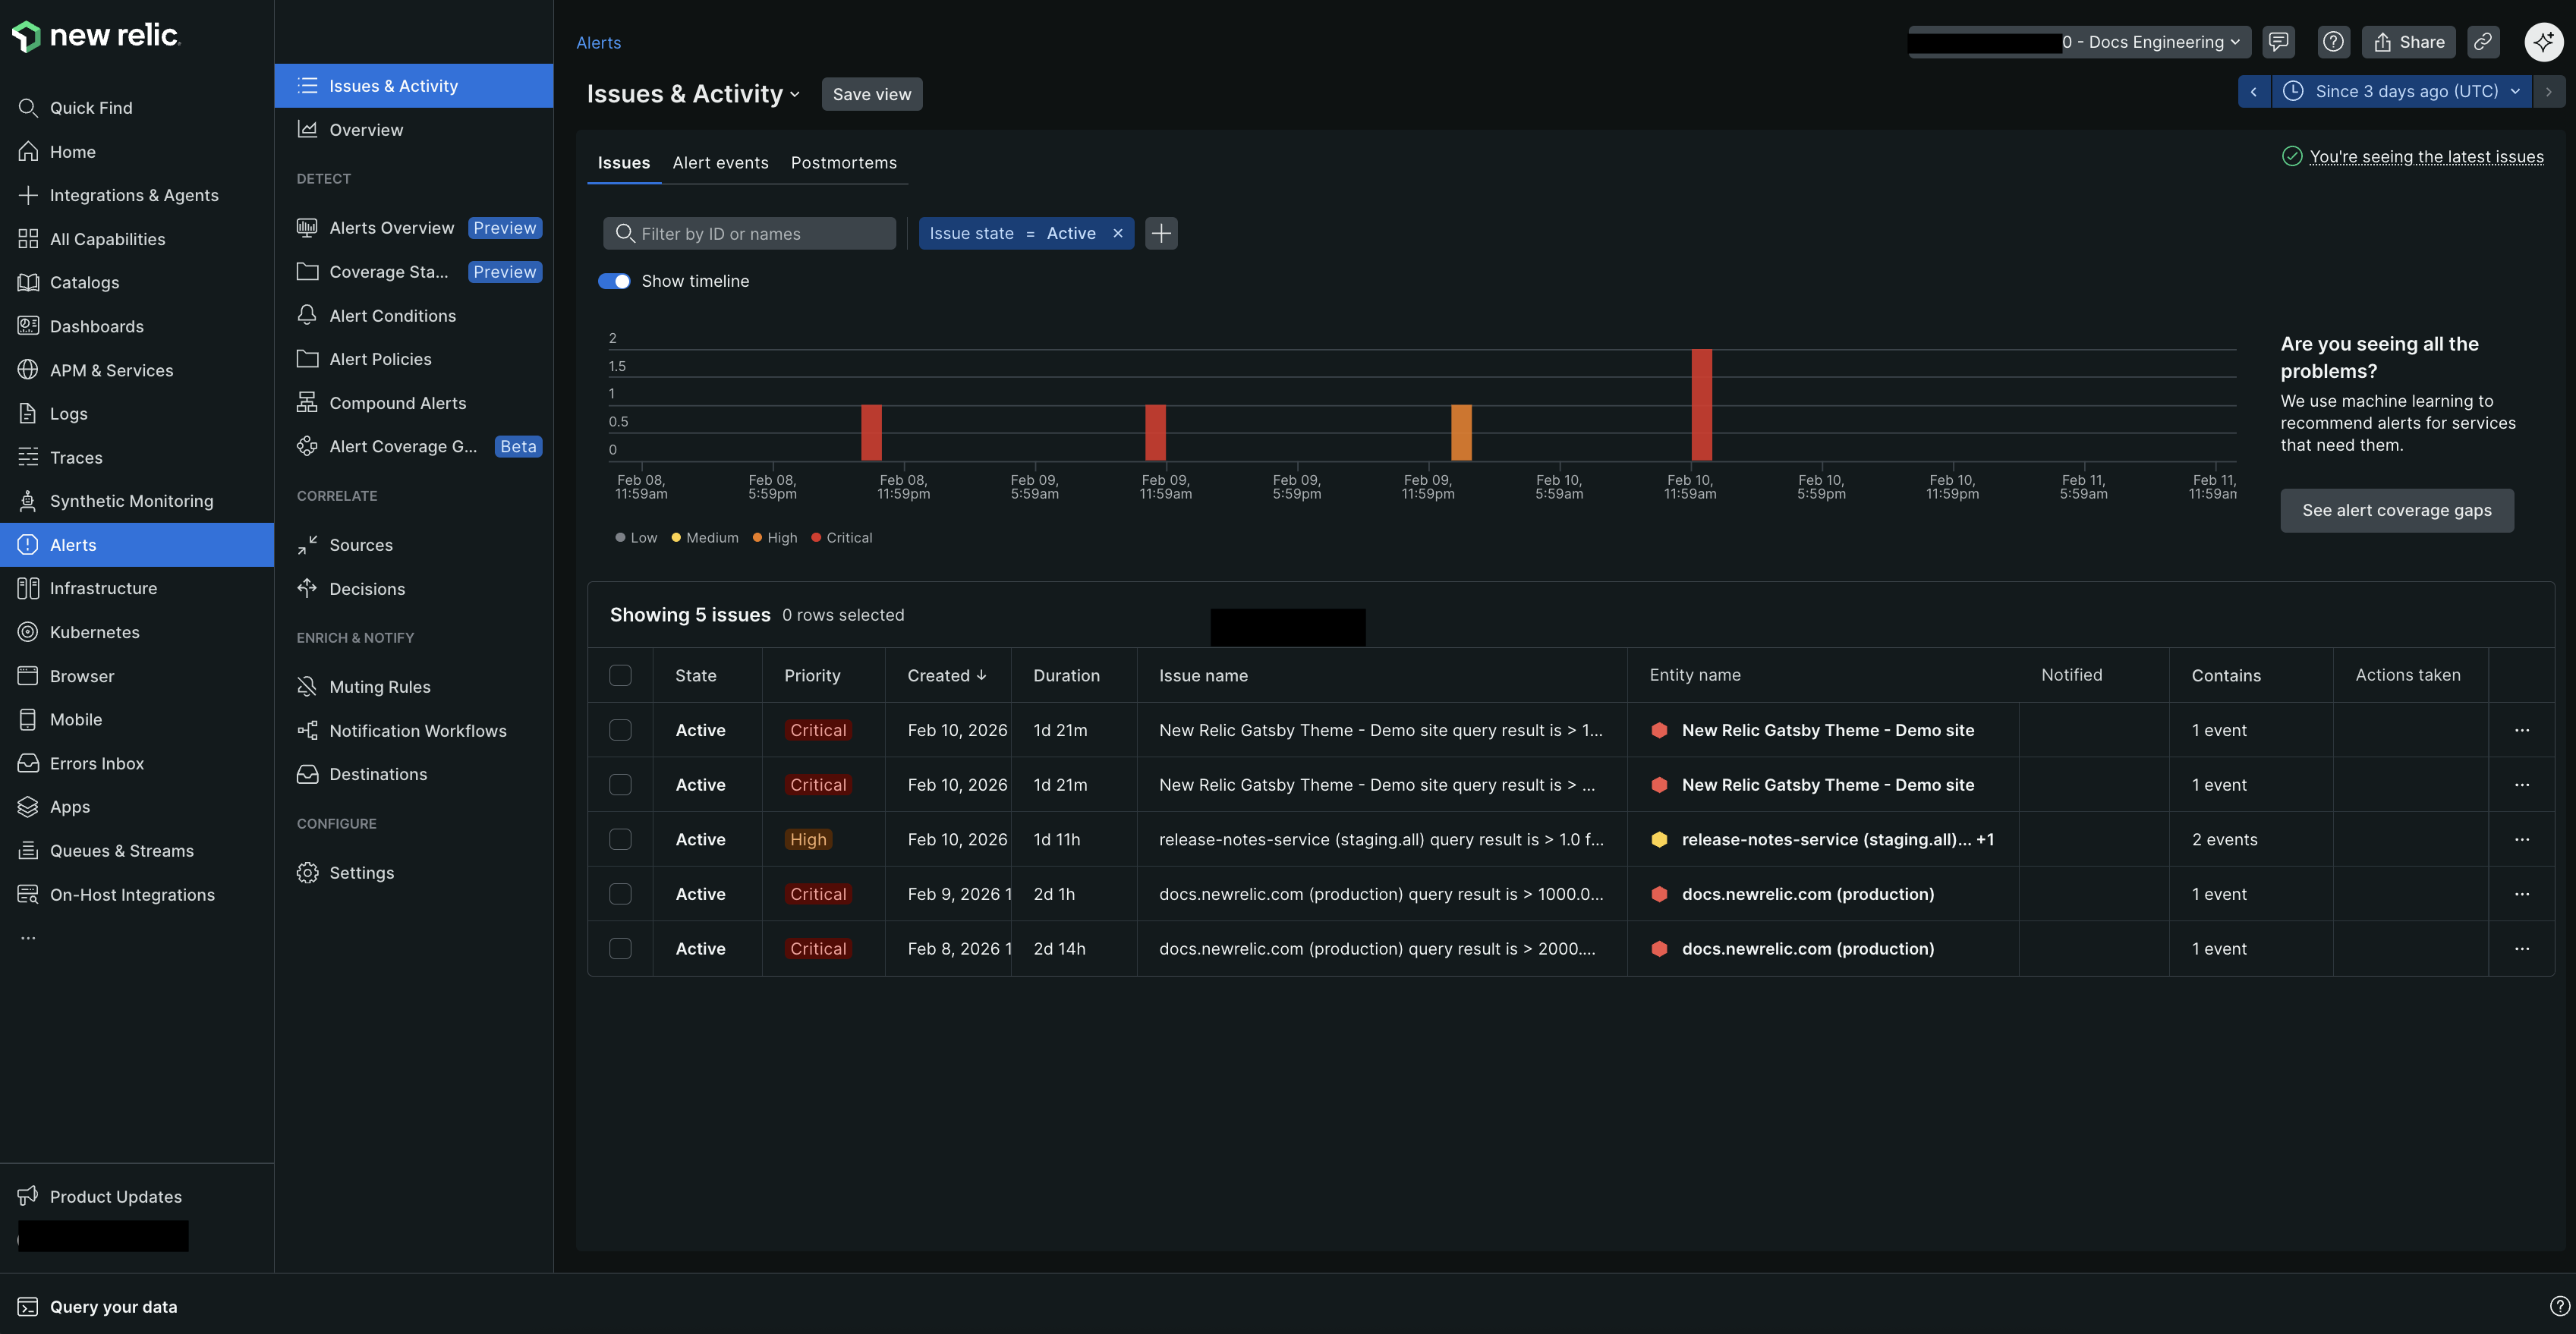
Alerts help you find issues and set notifications when something unusual happens in your applications and code. New Relic includes pre-defined upon installation, but you can also create your own. You can receive alerts through tools like PagerDuty, ServiceNow, Jira, Slack, and more. We can help you understand key info, like critical issues, manage the suppressed noise, and mitigate alert fatigue.
Learn more about alerts here.
Application performance monitoring (APM)
lets you monitor your apps and microservices. You'll start by instrumenting your app with one of our language agents. These agents then harvest different kinds of data in a process called data ingestion and then store that data in the New Relic Database (NRDB).
Learn more about APM here.
Browser
New Relic helps you understand website performance and user behavior by monitoring real user data. It tracks page load times, network requests, JavaScript errors, user interactions, and more. Analyzing navigation timing helps you find issues that hurt your web app's performance or backend errors. By making necessary changes based on this analysis, you can optimize the performance of your website.
Learn more about browser here.
Dashboards
With New Relic's dashboards, you can arrange your data how you want. Tailor for your application and system performance info. Adjust charts to show your key data and access these charts easily across our platform. This adaptability helps you monitor and study your data efficiently.
Learn more about dashboards here.
Errors inbox
Errors inbox is an error-tracking solution designed to put you in control of your environment. It helps you find, focus on, and fix errors across your application stack. Errors inbox is embedded in the UI so you can resolve errors faster.
Learn more about errors inbox here.
Interactive Application Security Testing (IAST)
New Relic IAST probes your applications by running your code for exploitable vulnerabilities. Use IAST to prevent cyberattacks, hide threads, and see all protected and unprotected applications. IAST comes with pre-built dashboards. They're thorough and show all high priority vulnerabilities.
Learn more about IAST here.
Infrastructure monitoring
The capability lets you monitor the health and performance of your service, including containers and cloud infrastructure. It covers tracking CPU, memory, network traffic, and disk use. It also includes over 400 on-host integrations for monitoring third-party apps.
Learn more about infrastructure here.
Kubernetes and Pixie
The New Relic Kubernetes integration gives you complete observability into the health and performance of your clusters and the workloads running on them. It includes a set of components that collect telemetry data, which are metrics, logs, and events. These components are the Kubernetes events integration, the Prometheus agent, and the New Relic Logs plugin.
Learn more about Kubernetes here.
Live archives
Live archives store historical logs with other logs and telemetry data in the NRDB. This allows instant access to historical logs and stops the need to reload, re-index logs, or move data between many locations or tiers for analysis.
Learn more about live archives here.
Logs
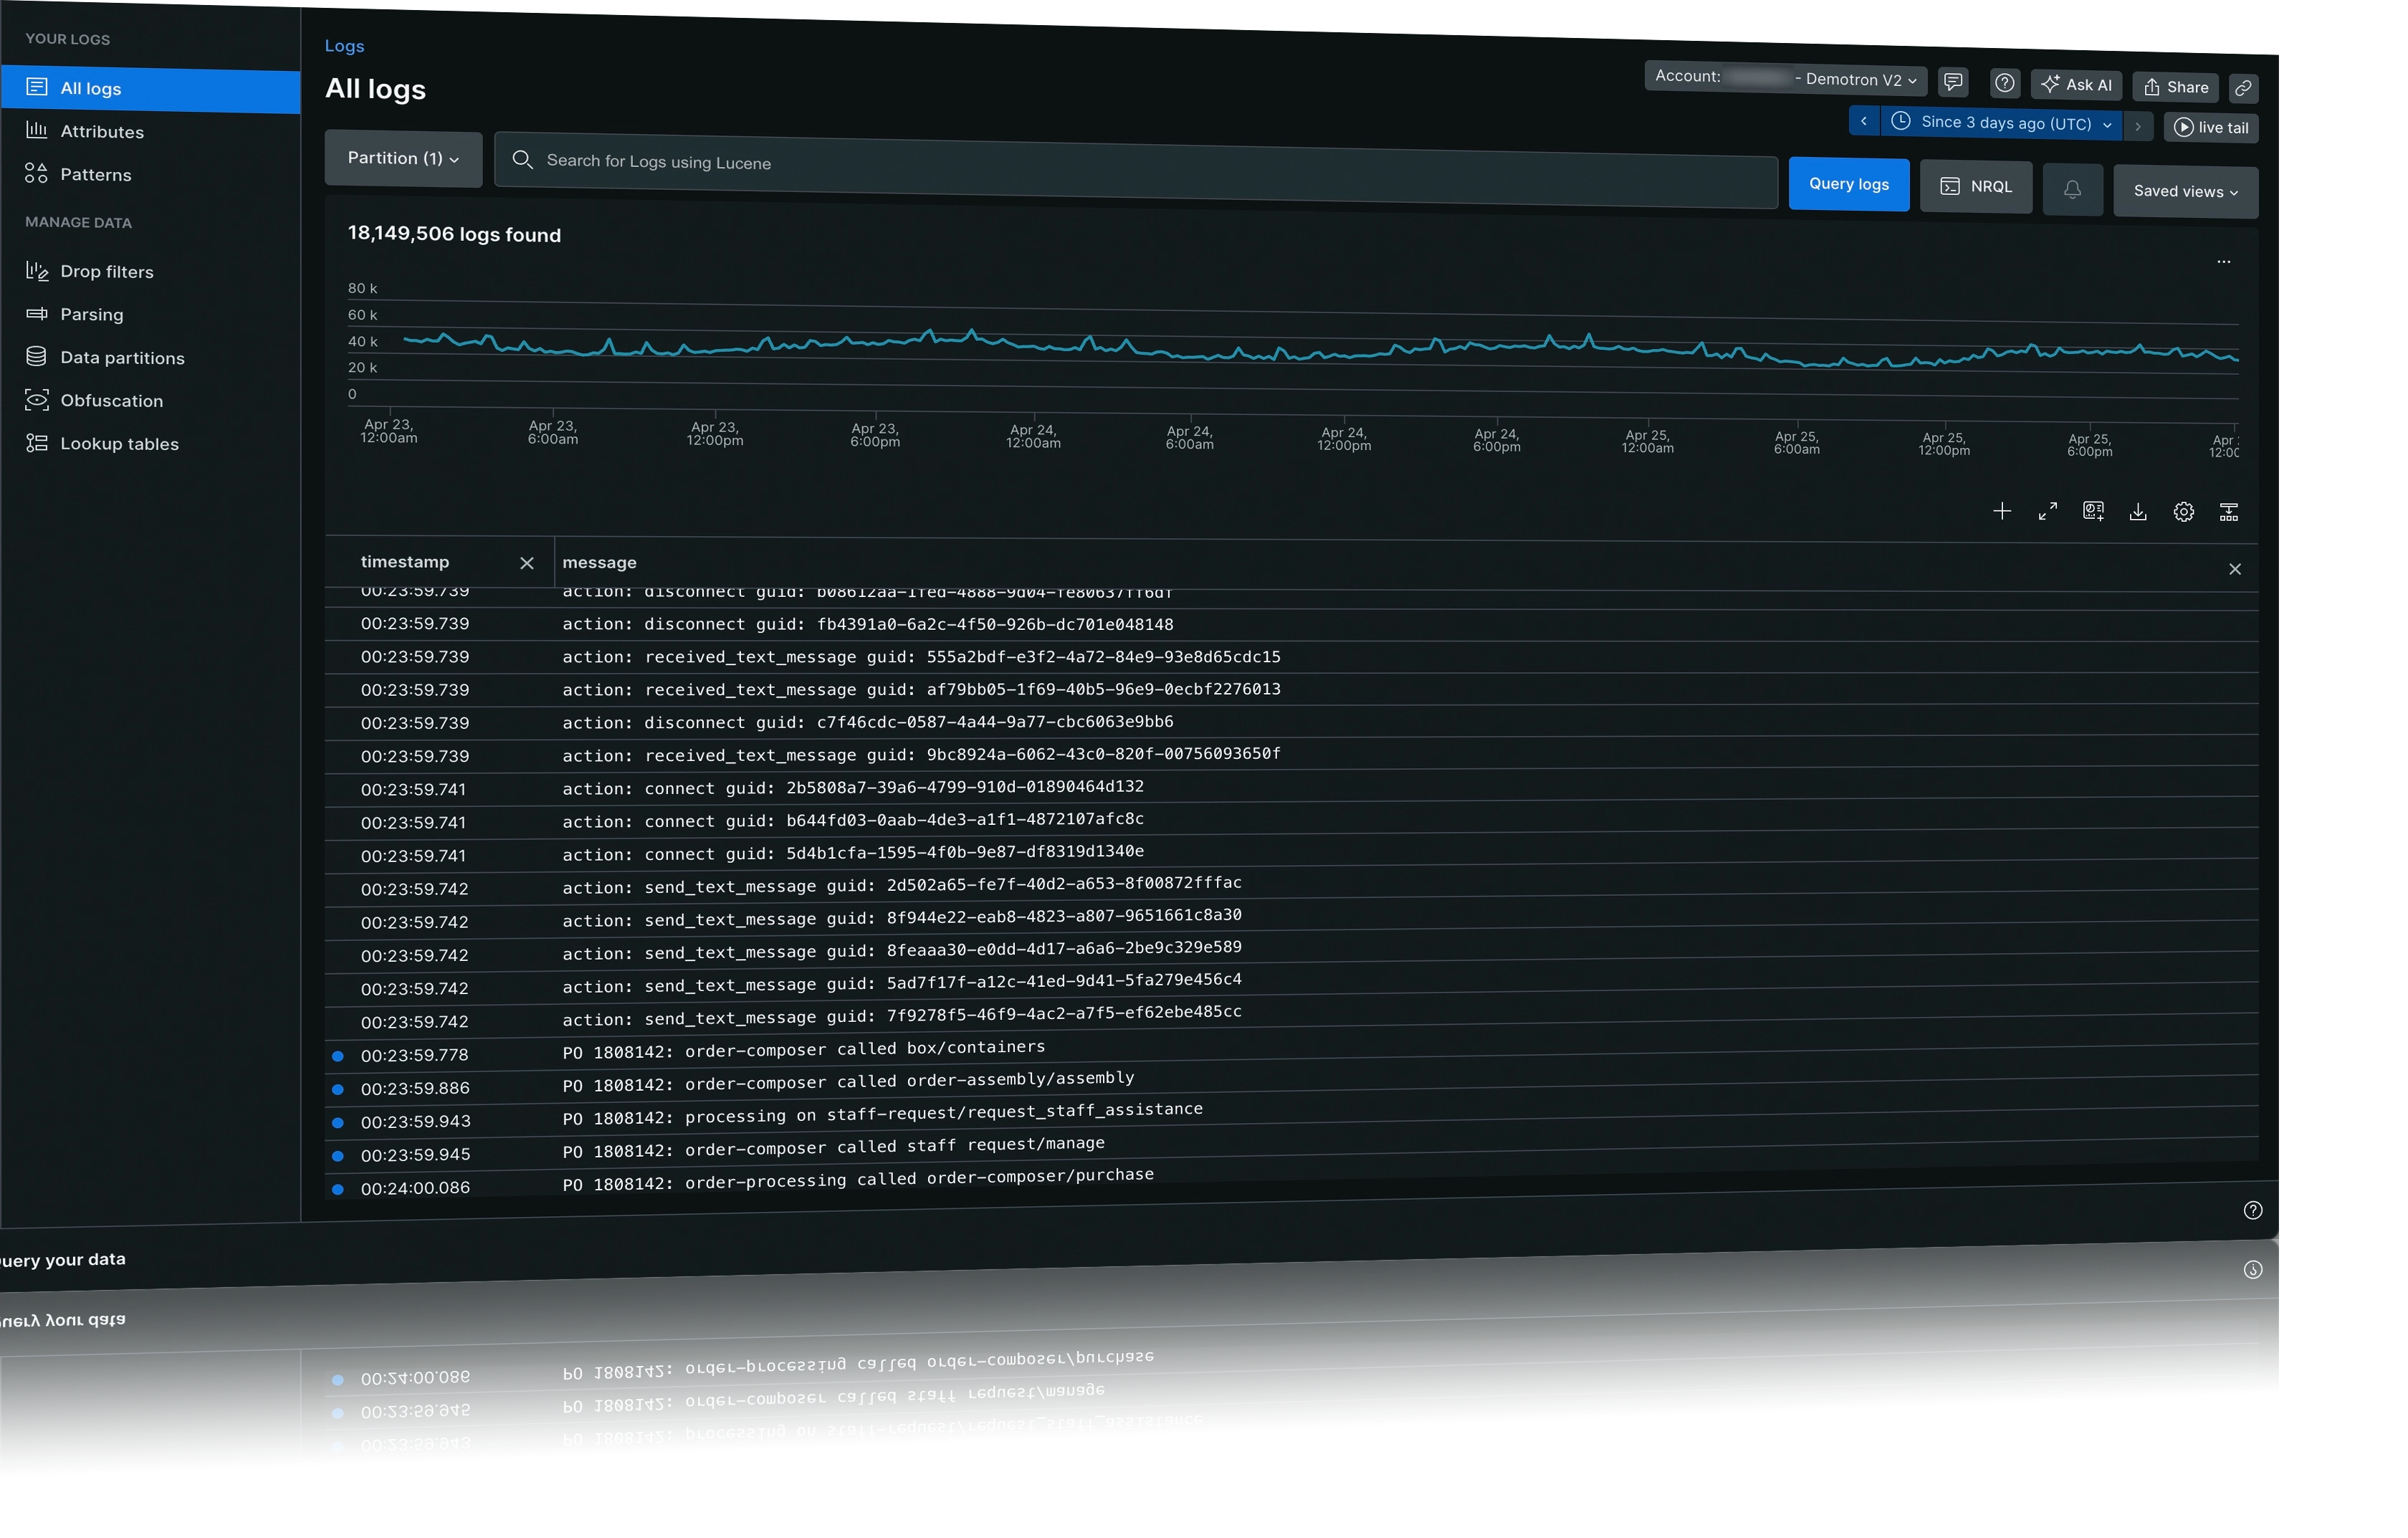
New Relic can help you manage large amounts of log data. New Relic give you centralized log management. You can use it to analyze applications and infrastructure. We offer a unified UI to forward logs from other logs providers, then view that data in a unified platform experience. We also offer tools that can help you sort through the clutter.
Learn more about logs here.
Network performance monitoring
You can use to analyze how well your routers, switches, and other networking devices perform. Network monitoring builds a network map for you, so you can identify when a network performance problem is happening.
Learn more about network here.
Mobile monitoring
The capability sends telemetry directly from the end user's mobile app to New Relic. Mobile monitoring is flexible, allowing you to troubleshoot crashes from Android, iOS, or hybrid mobile apps. Learn about HTTP and network performance to effectively collaborate with your backend teams.
Learn more about mobile here.
OpenTelemetry
OpenTelemetry helps collect data from your applications and hosts, sending it to New Relic. New Relic's platform lets you analyze the data and fix any application problems. This toolkit simplifies the process of monitoring and troubleshooting your software. By utilizing OpenTelemetry, you can enhance the performance and reliability of your applications.
Learn more about OpenTelemetry here.
Query your data
NRQL, short for New Relic query language, is a powerful SQL-like tool for accessing detailed data from New Relic. It lets you gather specific info about your applications, hosts, and business operations. By using NRQL, you can gain valuable insights into the performance and behavior of your environment.
Learn more about NRQL here.
Serverless and Lambda
We offer in-depth performance monitoring for your serverless AWS Lambda functions. Our Lambda layer gives one view into the details of your Lambda functions. You can understand what's happening in your serverless apps. Lambda monitoring is serverless and uses CloudWatch data and code-level tools to give you more in-depth data.
Learn more about serverless and Lambda here.
Service levels
With New Relic, you can set and use service level indicators (SLIs) and objectives (SLOs) for your applications. Service levels measure the performance of a service from the end user (or client application) point of view. We measure service levels with indicators, comparing them to set objectives for performance and outcomes.
Learn more about service levels here.
Synthetic monitoring
The capability is our proactive monitoring solution. It lets you simulate how users might use your front-end apps and services. You can set up synthetic monitors to run certificate checks. They can ping a page for availability and run through common user journeys. They can also ensure your APIs are working as expected. Stay ahead of potential problems so your customer experience is never affected.
Learn more about synthetics here.
Vulnerability management
Vulnerability management provides a birds-eye view of all your software's vulnerabilities. Use our to find the most urgent vulnerabilities. Calculate the vulnerability surface area of your software and assign vulnerabilities to users with explicit steps for fixing them.
Learn more about vulnerability management here.
How it works
The first step in observability requires collecting lots of performance data, known as telemetry data. Our observability platform gathers data from your services using agents. An agent is a file or a few lines of code that collects data on your service and sends it to our platform for analysis. Instrumentation is the process of making something measurable. Agents integrate into a service as part of this process. You might instrument a gas tank by installing a meter that measures how full or empty your tank is. You monitor your tank; when it approaches empty, you know it's time to fill up again.
New Relic does something similar. An agent is a file or piece of code that you attach to a particular service during an installation procedure. Like a gas meter, our agents keep track of the service's performance by monitoring metrics such as response times and error rates. By analyzing this data, you can gain insights into the functioning of your service and identify areas for improvement. An agent is first installed in your environment with a default configuration. The process of installation, setup, and instrumentation can vary. It depends on the service you want to collect data from.
These are the agents at New Relic:
APM agent: For server-side applications
Browser agent: For browser applications
Infrastructure agents: For hosts and on-host integrations
Mobile agent: For mobile applications
Besides these agents, we also support open-source integrations. They report data from open standards for instrumentation. These standards include OpenTelemetry and tools like DropWizard, Prometheus, and more.
Get started
Sign up for New Relic if you haven't already
Ready to get started? If you haven't already, sign up for a New Relic account. It's free, forever.
Signing up takes only a few minutes. Once you have an account, you can begin monitoring your applications.
Add your data
Add your data to New Relic to begin analyzing and understanding it. Our guided install will detect your environment so you only have to select the systems you wish to monitor.
Click the Guided install button. Or, if your organization is located in an EU data center, click EU Guided install.
If you want to add more data from other sources, check our quickstart page to add data sources to your monitoring system.
If you prefer a manual installation, see the New Relic manual installation.
Explore your data
Analyze data from all connected applications in New Relic to identify issues and view performance metrics. Examining this data helps you identify issues within your applications and make informed decisions to optimize performance. Explore your data to get instant visibility into all your telemetry data.
Query your data
Write your first query using our New Relic Query Language (NRQL). You can query data from your applications and understand insights from your data. With NRQL you can analyze your data for better decision making. Query your data to gain insight into your applications, hosts, and business-critical activity. Correlate performance metrics with business KPIs to speed up MTTD and MTTR.
Set up a dashboard
Although our quickstarts include pre-defined dashboards to monitor your system, you can create and configure your dashboards. Our dashboards allow you to create and share interactive visualizations of any data you need to see from anywhere on the New Relic platform. Use dashboards to provide context and visibility into what your system is doing in real-time.
Configure alerts
Although our quickstarts include pre-defined alerts to monitor your system, you can create and configure your alerts. Use alerts to set thresholds and receive notifications of changes in performance across your system. This will help you stay ahead of performance issues to avoid negative impacts on your users. Keep your team focused and productive with intelligent alert event management.


