Modern applications are complex. You're managing multiple services, databases, APIs, and dependencies—all while trying to deliver fast, reliable experiences to your users. When something goes wrong, finding the root cause can feel like searching for a needle in a haystack.
The cost of application performance problems
Without proper monitoring, application issues impact your business in measurable ways:
- User experience suffers - Slow pages drive 53% of mobile users away after just 3 seconds
- Revenue at risk - Every 100ms of latency can reduce conversions by 7%
- Team productivity drops - Developers spend 75% of their time troubleshooting instead of building features
- Incidents escalate - Problems discovered by users, not your team, damage reputation and trust
Transform your application performance
New Relic APM gives you the visibility and insights to proactively manage application performance:
Catch issues before users do
- Real-time error tracking with intelligent alerts
- Proactive anomaly detection powered by machine learning
- Instant notifications when performance degrades
Pinpoint problems in minutes, not hours
- Detailed transaction traces show exactly where slowdowns occur
- Database query analysis identifies bottlenecks
- Code-level insights reveal performance hotspots
Optimize with confidence
- Apdex scores quantify user satisfaction
- Performance baselines track improvements over time
- A/B testing impact measurement

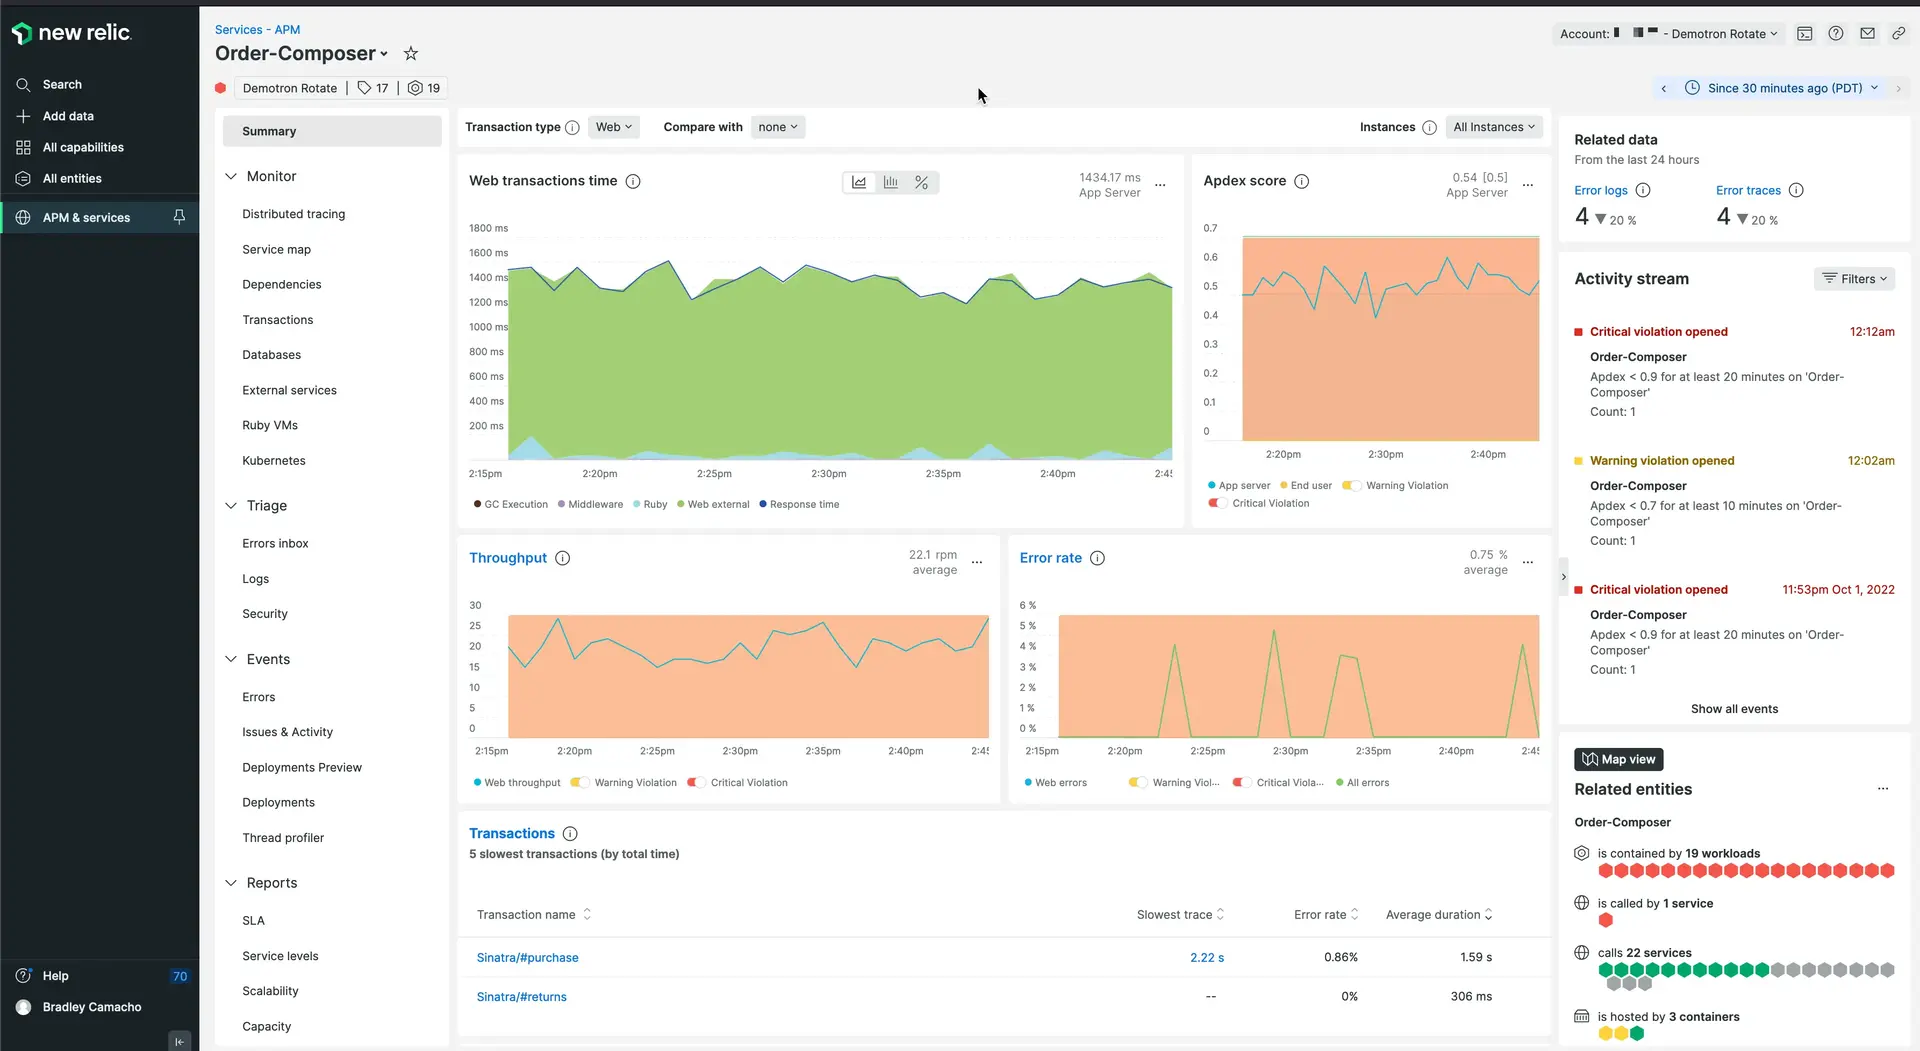
View the status of all your services at a glance with APM.
How APM monitoring works
APM monitoring is simpler than you might think:
- Install lightweight agents - Add a small library to your application that automatically instruments your code without requiring changes
- Automatic data collection - Agents track performance metrics, errors, and user interactions with minimal overhead (< 3% performance impact)
- Real-time analysis - Data flows to New Relic where AI algorithms detect patterns, anomalies, and trends
- Actionable insights - Pre-built dashboards and alerts give you immediate visibility into what matters most
Your applications continue running normally while gaining comprehensive observability across your entire stack.
Get started in minutes
Transform your application monitoring today. Choose your language and start seeing performance insights within minutes:
Tip
Free tier available - Monitor up to 100GB of data per month at no cost. No credit card required.
What happens after installation:
- Immediate insights - See performance data within 2-3 minutes of deployment
- Automatic baselines - APM learns your application's normal behavior patterns
- Smart alerts - Get notified only when issues truly impact user experience
- Guided optimization - Receive specific recommendations to improve performance
Important
Need help getting started? Each agent includes step-by-step installation guides and troubleshooting support. Most teams are up and running in under 15 minutes.
Ready to transform how you monitor application performance? Start your free trial or estimate your costs first.
What you'll see immediately
Once your agent is installed and sending data, you'll have access to:
APM Summary dashboard
- Response time trends and throughput metrics
- Error rate tracking with stack traces
- Database query performance analysis
- External service call monitoring
Advanced capabilities
- Full-stack observability across all your applications and infrastructure
- Custom dashboards tailored to your specific needs
- Intelligent alerting that learns your application's behavior
- Entity relationships showing how your services connect and depend on each other