There are several ways to report your logs to New Relic. Using our APM agents is one popular way, especially for smaller teams and DevOps teams that value the benefit of not having to use any other tools.
Tip
Got lots of logs? Check out our tutorial on how to optimize and manage them.
APM logs in context
Our agents have a feature called logs in context. For more on the benefits of this feature, see Logs in context.
For APM agents, our logs in context feature does a few things:
- Decorates your app logs with important New Relic metadata (like
span.id,trace.id,hostname,entity.guid,entity.name) that allows you to see your log data in various New Relic UI experiences. - Forwards your logs directly to New Relic, so you don't have need for any third-party tool.
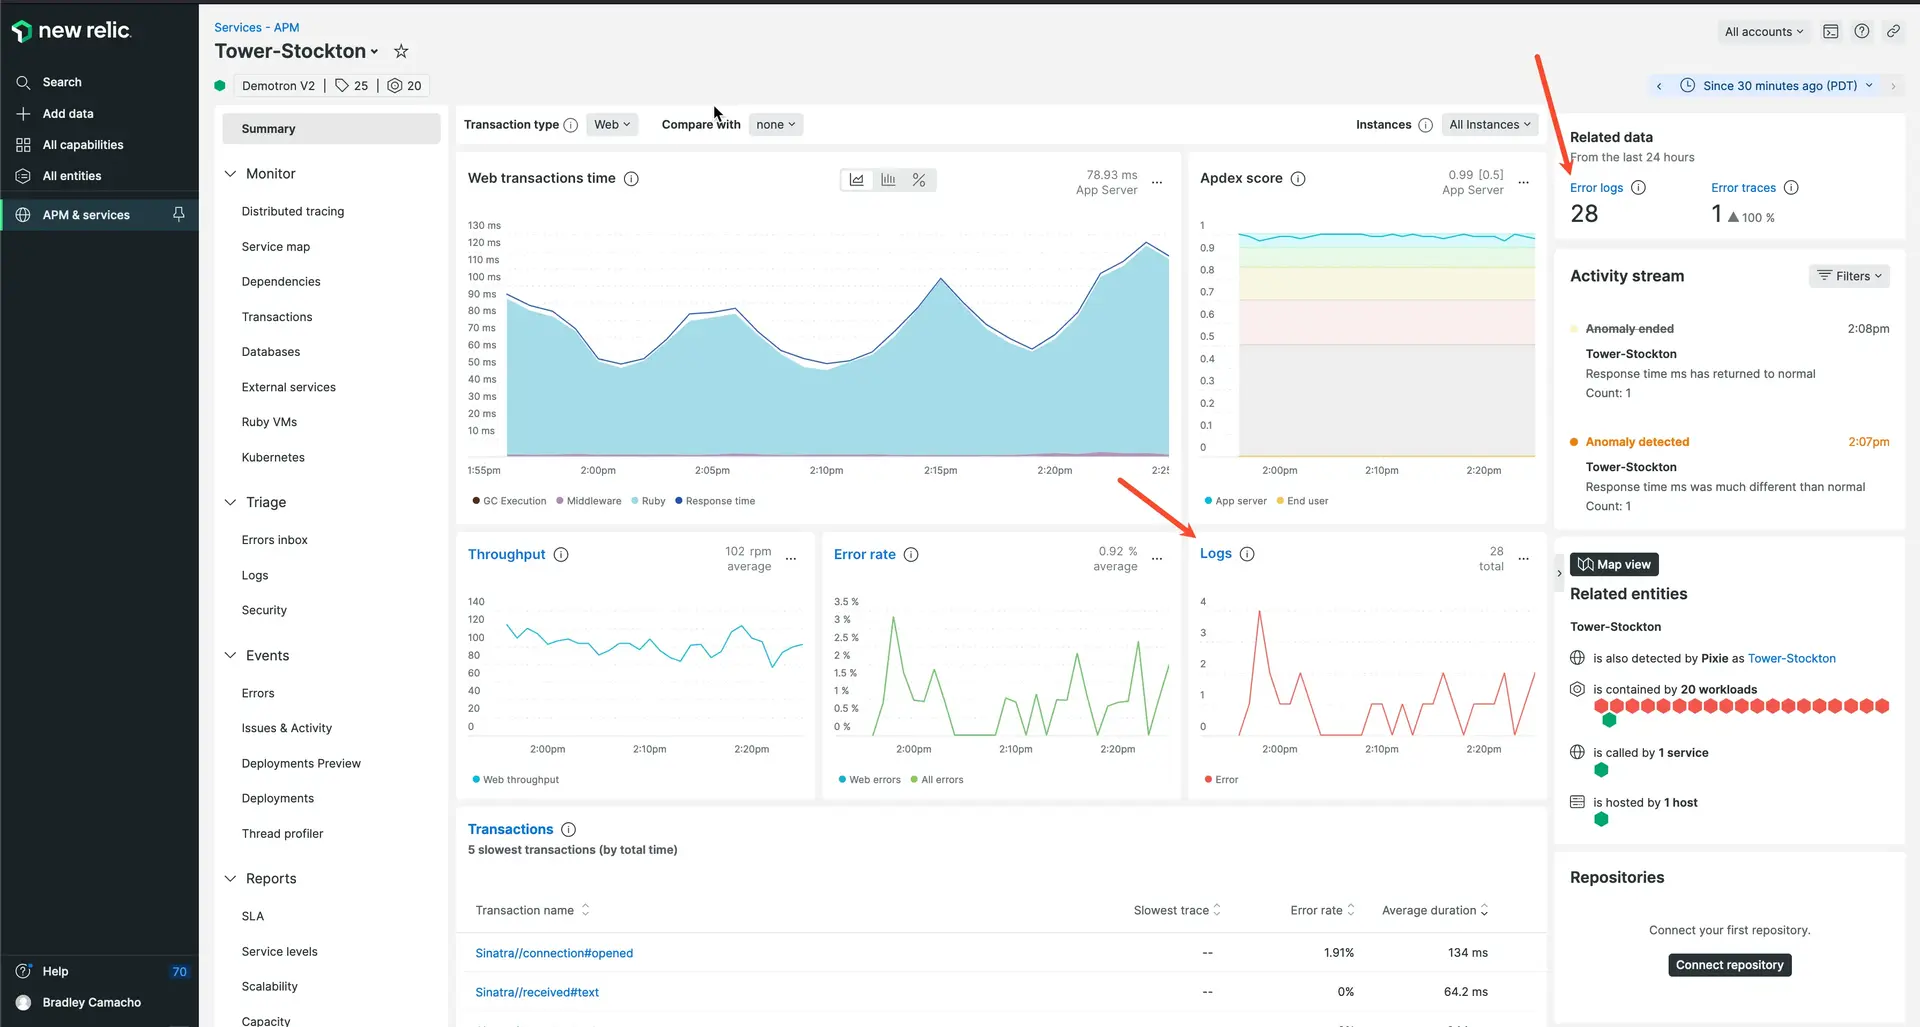
- Reports some logs metrics. These are displayed on the Logs chart on the APM Summary UI page.
Our current APM agent versions have these features enabled by default.
You have control over all aspects of this feature via APM agent configuration. For reasons you might want to disable one or more of these, see Limitations. For example, if you want to have an APM agent add New Relic metadata, you can use the log decoration feature, while at the same time disabling log forwarding and instead using another logging agent (for example, our infrastructure agent, or a third-party logging agent).
The implementation details and configuration instructions vary per agent (see agent details).
To learn more about the power of logs in context, see this example use case. The example describes how an engineering team used logs in context to troubleshoot their app's poor response time and rising error rates.
To see how logs in context can help you find the root cause of an issue in your apps and hosts, watch this short video (approx. 3:40 minutes):
Get started
To set up logs in context:
- If you don't have one already, create a New Relic account. It's free, forever.
- Install an APM agent, making sure you have the latest APM agent version.
- The newest versions of our APM agents have logs in context (addition of metadata and forwarding) enabled by default. You may sometimes have to make some updates to the agent config file to get logs working correctly. For details on this, see Enable logs for your agent.
That's it! Start troubleshooting your applications with APM logs in context by going to the APM UI and looking for associated log data.

Drill down into your logs, traces, and errors, all from the APM Summary page in New Relic.
APM agent APIs
If your logging framework is not available with our existing logs in context solutions, you can configure your logging libraries by using API calls to annotate your logs.
APM agent log configuration
Our latest agents have logs in context (log decoration and log forwarding) enabled by default. Here's information about the APM agents that support logs in context and log forwarding:
- Go logs in context procedures for agent v3.17.0 or higher
- Java logs in context procedures for agent v7.6.0 or higher
- .NET logs in context procedures for agent v9.8.0 or higher
- Node.js logs in context procedures for agent v8.11.0 or higher
- PHP logs in context procedures for agent v10.1.0 or higher
- Python logs in context procedures for agent v7.12.0.176
- Ruby logs in context procedures for agent v8.6.0 or higher
If you can't or don't want to use APM log forwarding, you can forward your logs using another solution.
Limitations
APM logs in context features are enabled by default. This can have a negative impact on your security, compliance, billing, or system performance.
Here are some additional known limitations:
- With the exception of the Node.js agent, log forwarding doesn't send the complete log. Learn about log forwarding details.
- Startup logs are not available until after the agent is loaded.
- If you're using Kubernetes, be aware that we decorate the logs via instrumentation, not from the Kubernetes API. This is separate and apart from the writing logs out to the filesystem. The logs never touch the host or exist in a place where the API can be called.
- When an exception is thrown from your application, currently you will not see stack traces in the associated logs in context for Java or .NET agents. As a workaround, you can change your drop filter rules.
- Fluentd can add the
processIDfrom the entity that generated the log, but APM logs can't see that. Also, in Kubernetes, the API is called to add metadata, but this data cannot be seen from within the application. If you need the entity metadata, we recommend that you use automatic logs in context, but do not ship the logs from the application. Instead, continue to use Fluentd, Fluent Bit, or another solution to forward the log files.
If you need to adjust the default settings, see Disable automatic logging.
Ensure data privacy
Caution
You control what log data is sent to New Relic, so be sure to follow your organization's security guidelines to mask, obfuscate, or prevent sending personal identifiable information (PII), protected health information (PHI), or any other sensitive data.
Our log ingest pipeline automatically masks credit cards, Social Security numbers, national IDs, etc. For more information, see our security documentation for log management.
You can also create custom rules to mask or hash sensitive data in your logs with our obfuscation feature. This is critical when it is impractical or impossible to restrict access to sensitive data, or when some data should never be stored by New Relic. Read our obfuscation documentation to find out more.
Details about log forwarding
For all agents (except Node.js), the log forwarding option doesn't forward the entire log. For details about what gets sent with log forwarding, see the collapser below.
If you require more of the log reported, options include:
- Configure the APM agent to include specific log data.
- Keep the log decoration in place but disable APM agent log forwarding and instead use your own log forwarding solution.
For more on these options, see the agent-specific logs-in-context docs.
Log metrics
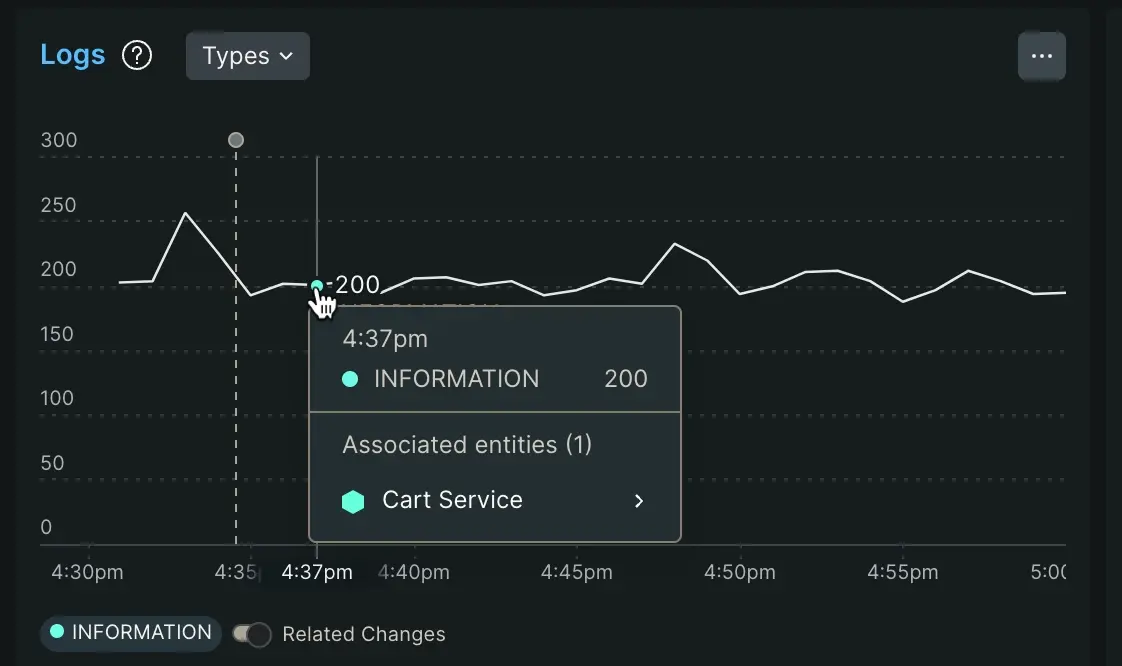
When you set up an agent, you automatically get a chart of logging metrics on the APM Summary page:

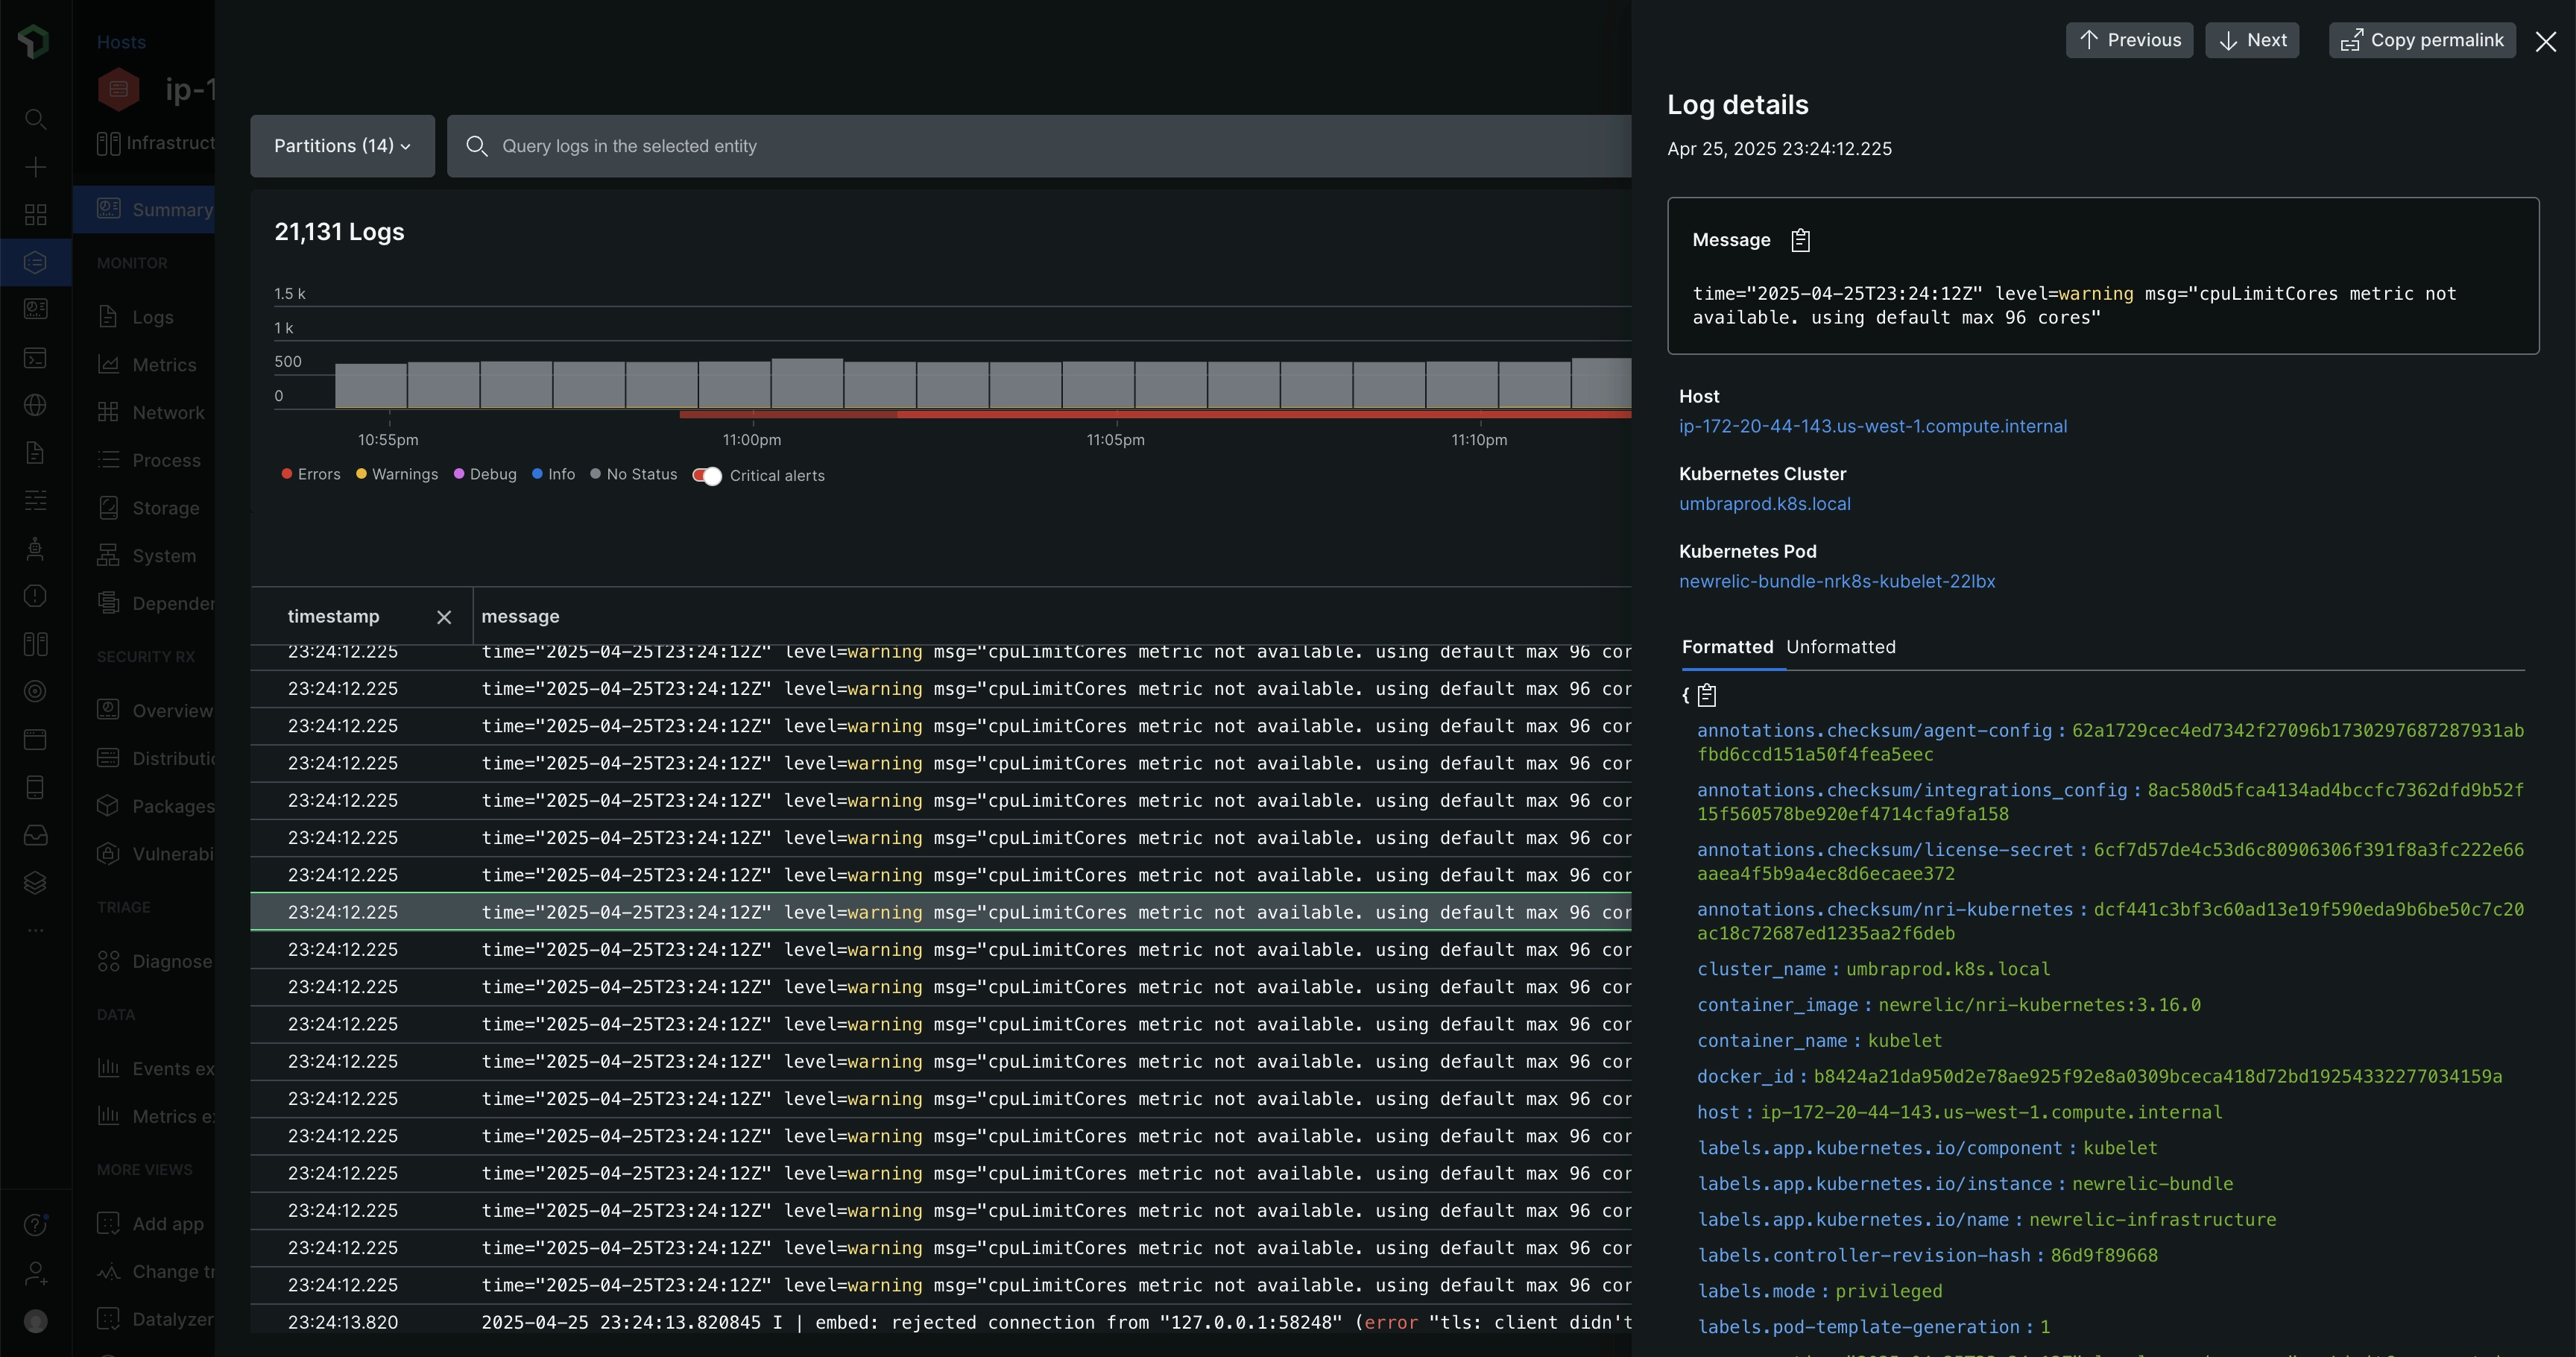
This chart shows a count of logs. If you haven't disabled log forwarding, you can click on the chart links that will take you to the logs themselves. Even if you disable log forwarding, this chart still shows the potential logs you could inspect if you had log forwarding enabled.
Logging metrics are reported via the apm.service.logging.lines attribute, as shown in the following query:
SELECT count(apm.service.logging.lines) FROM Metric WHERE (entity.guid = 'AN_ENTITY_GUID') LIMIT MAX SINCE 60 seconds AGO TIMESERIESIf you don't want to see the logging metrics chart, you can turn it off—but not at the account level. To disable logging metrics, see the dedicated APM configuration docs for your agent (for example, this logging_metrics config option for PHP).
Important
If you disable logging metrics, that doesn't turn off the APM log forwarding feature. To stop forwarding APM logs, see Manage or disable APM logs in context.
Prevent duplicate logs
Using logs in context functionality will increase your data ingest. Depending on your account's pricing model, this may have an impact on your ingest limits and billing.
Caution
If you want to use the APM agent to send logs directly from your applications, you must disable or modify log forwarding solutions that are currently collecting logs from those applications. Otherwise you will be sending duplicate logs, which will result in double billing.
Check our upgrade guide to learn more about how you can avoid sending duplicate logs.
For more information, follow the procedures to disable your specific log forwarder.
Manage your ingest limits
Example: Your engineering team is troubleshooting a problem with your app, so you temporarily increase the volume of logs collected by the APM agent to provide more granular logging. However, if you leave higher limits running for several days, this could lead to sending unnecessary data that will increase your bill.
To avoid any surprises, we recommend that you use NRQL queries to create alert conditions to keep track of your ingest limits. For example:
Example: The power of logs in context
Here is a detailed use case of using logs in context to get to the root cause of a problem.
Example scenario: The on-call engineer receives a New Relic alert notification about poor response time and rising error rates for their app. They need to discover the root cause behind the increase in errors and latency, so they can decide whether to rotate a problematic host out of load balancing or to roll back the most recent release.
To start troubleshooting, they go to the New Relic UI.


