With APM Group errors tab you can dynamically filter and group errors for deeper analysis.

Errors list view
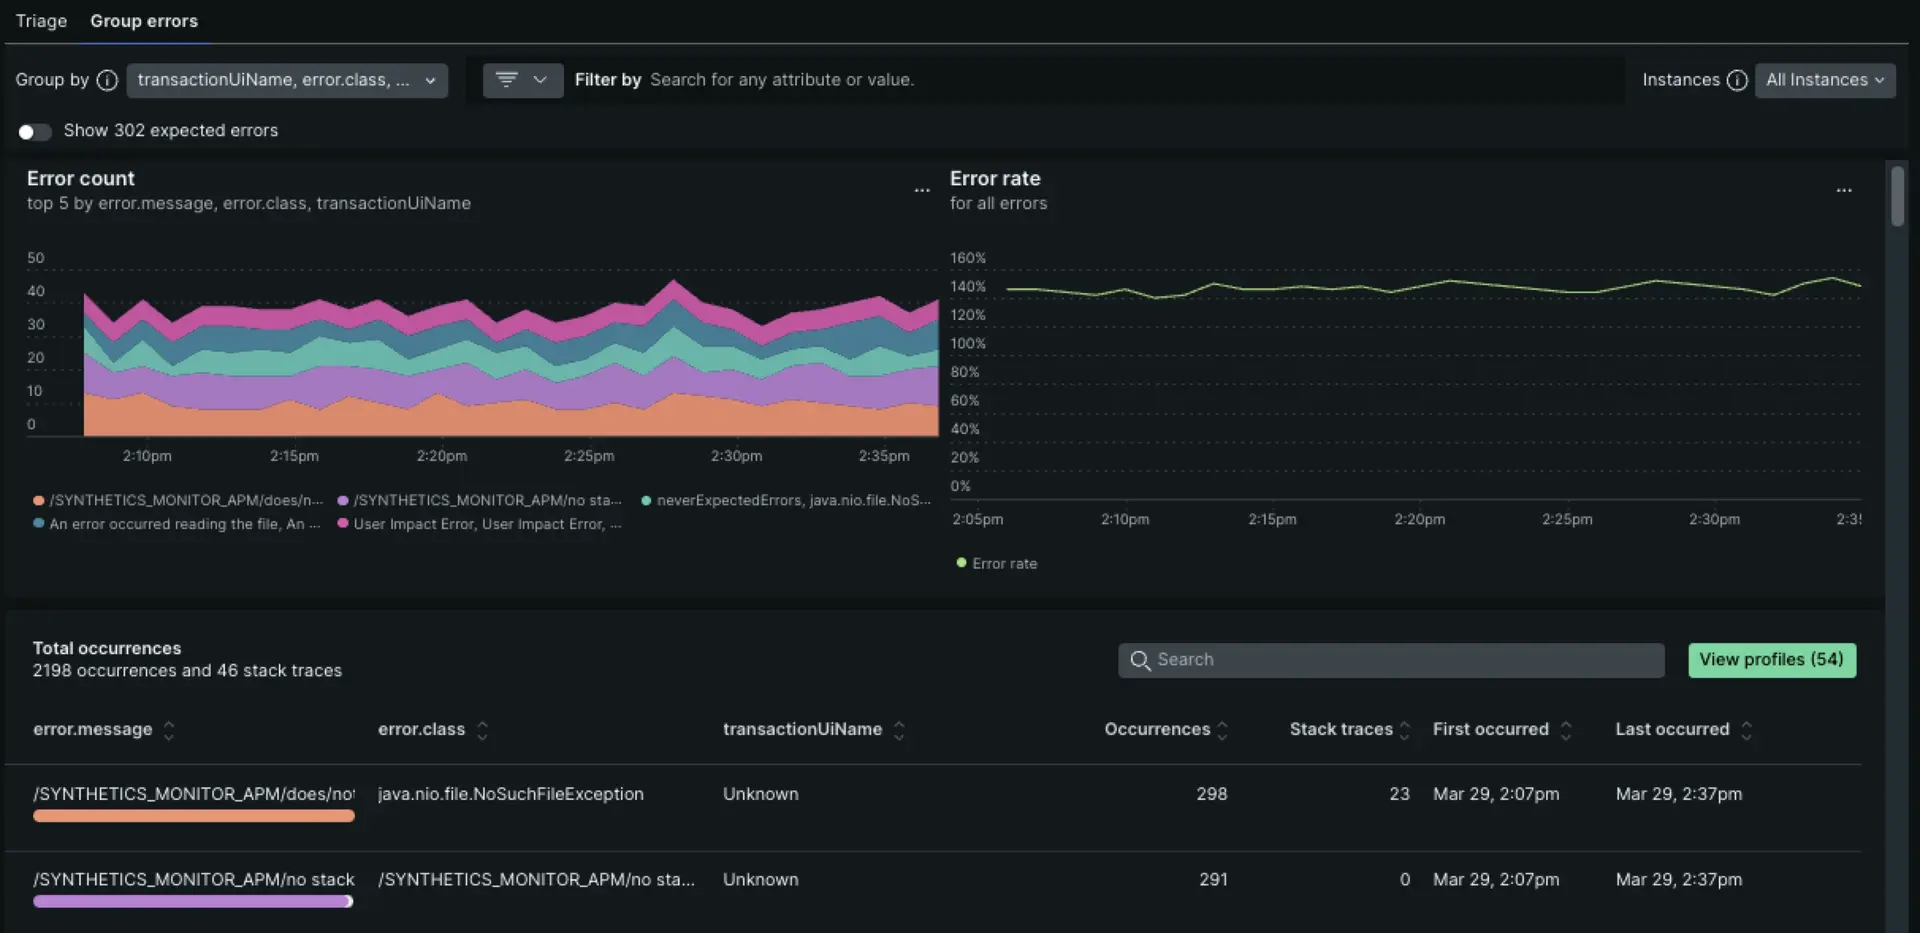
Start with the error rate charts to see at a glance whether there are any unexpected spikes, dips, or patterns with errors in general.
Correlate any general patterns on the top 5 errors chart to alerts occurring during the same time period.
- Dynamic grouping: The default grouping for error occurrences is based on error message, error class, and transaction UI name. You have the option to change the grouping options by any attribute, up to five attributes at a time.
- Filtering: Many New Relic customers instrument custom attributes. Filtering on a specific custom attribute can be a quick way to cut through the noise of all error occurrences.
Error profiles

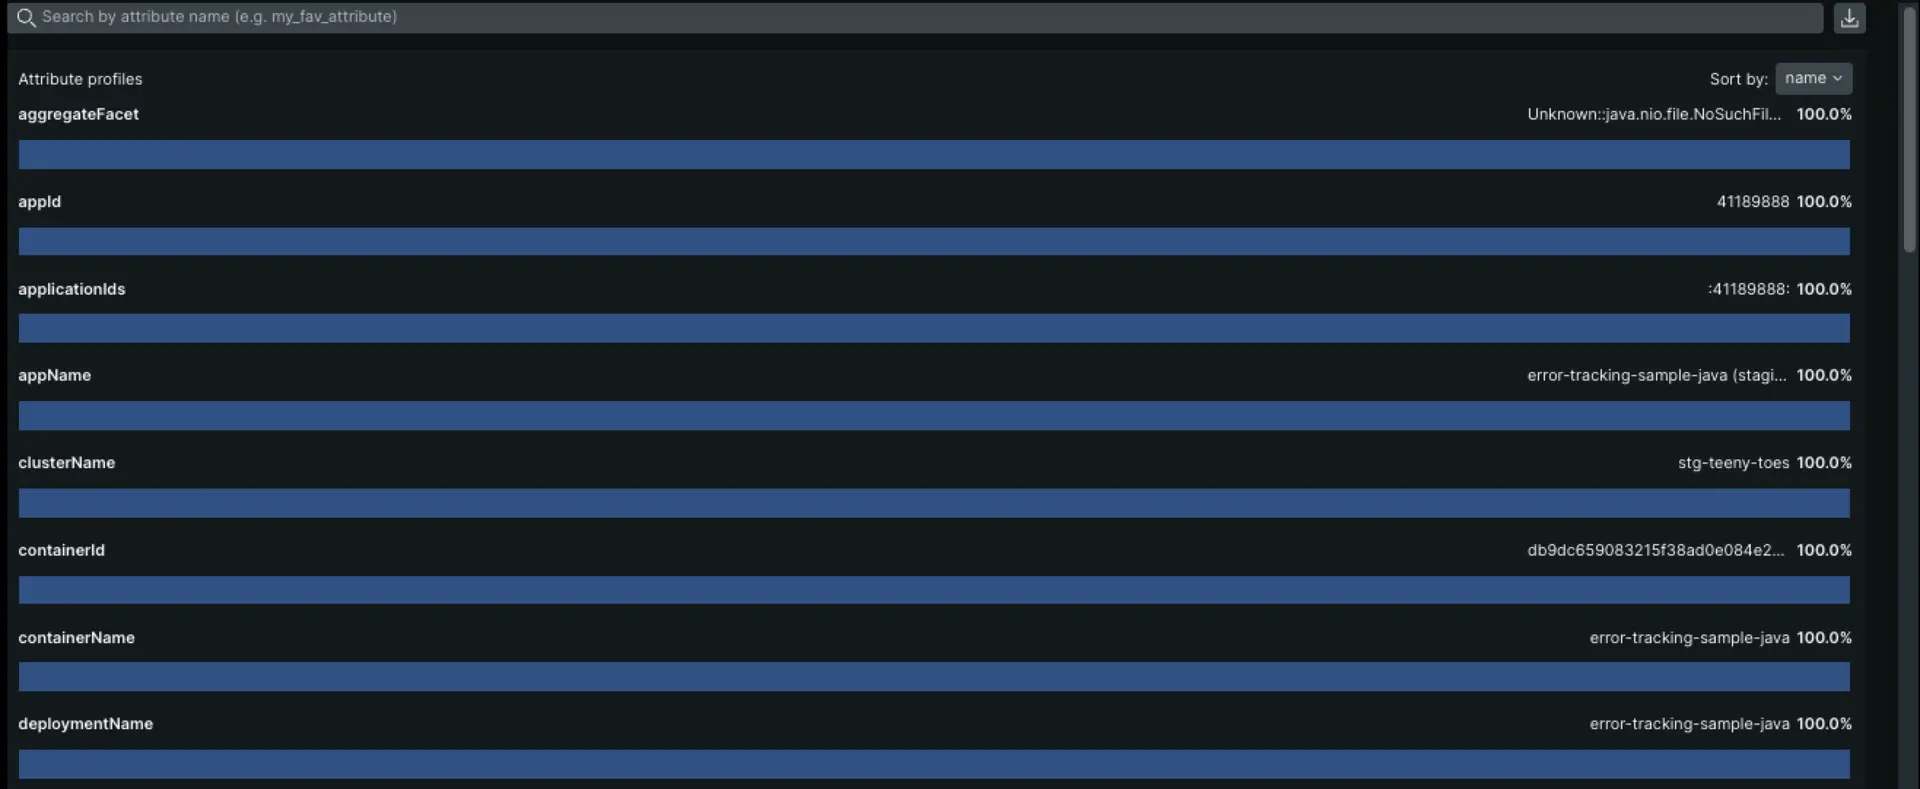
Error profiles can help you answer questions like, which users were most common across all the error events during the selected time window? Or which session was most common across all the error events during the selected time window?
Click Attribute profiles to expand into invidiual profiles.

Errors details view
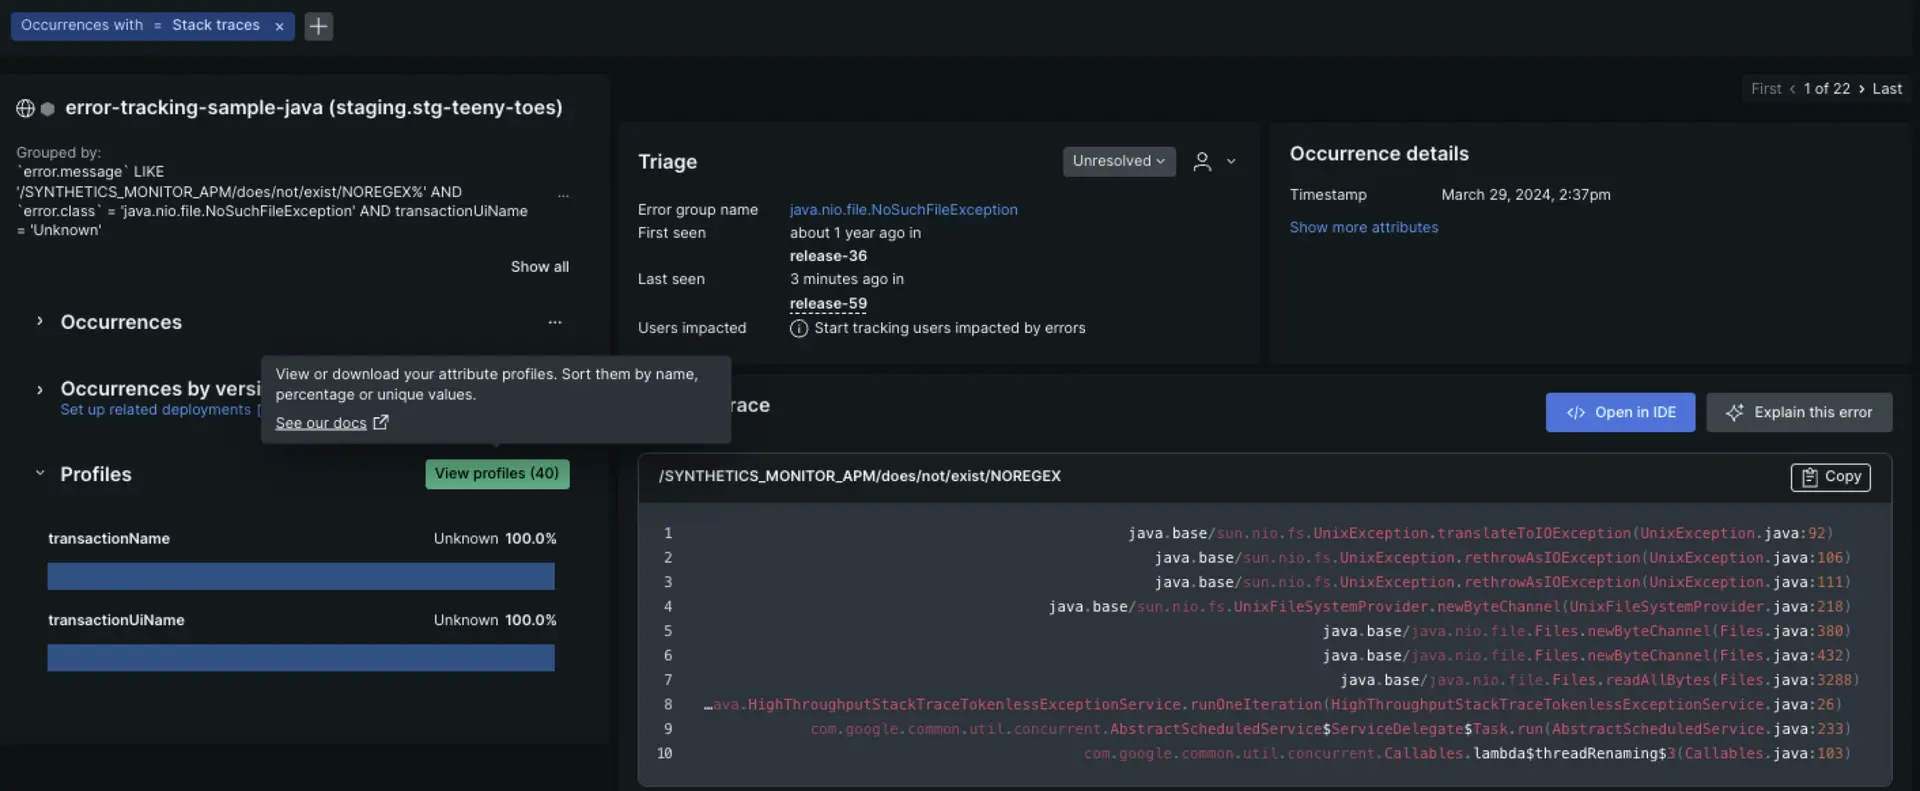
On this page, you can dive deep into a specific error group: Perhaps you've identified a specific group of hosts that is causing an error spike. The detailed view provides in-context details.
From the detailed view, you can cycle through specific errors using the toggle in the upper right to navigate between the first instance of the error, the last, or any instance between.
At the top of the details page, you can inspect the Filtered and Grouped By fields to see how the information was filtered and grouped. You may receive a permalink of a specific occurrence. It's important to know the filters and group-by selections to understand the context of the occurrence.
Occurrences tab
The Occurrences tab includes not only error frequency, occurrence details, and stack traces, it also includes triage information and related distributed traces.
Triage section
The triage section links the specific error occurrence you're viewing to a system-created error group that has a unique fingerprint. Why does that matter? That unique fingerprint enables you to triage an error group using a status update or assignment. The system-created error groups are the ones you find on the Triage tab. For more info on how they are generated, see How error groups work.

Distributed tracing
If you've set up distributed tracing, and if there are sampled traces related to errors, you'll see options to view trace details. This is a quick way to view trace information without going to the main distributed tracing page:
In the left pane labeled Distributed traces, you can expand the heading to show a list of all traces associated with errors in this error group. Alternatively, you can click Explore all to open a list of all the traces.

In the right pane labeled Distributed trace, you'll see the trace that's associated with the error occurrence displayed on this page. To see the trace's spans in a waterfall view:
Click directly on the trace name or click the icon with an arrow on the right, which opens up the waterfall focus view that highlights trace spans with errors.

Click Explore to open an unfiltered waterfall where you can click through all the spans.
Select the time period for error data
Use the time picker to examine the details of error events over the past week, month, or other time range.
- Error event data in the Group errors tab is available for up to a 7 day window of data collected over the last eight days.
- Error event metadata in the Triage tab is stored up to 13 months.
You may notice slight differences in count if your time window is set to "ending now". This occurs because the counts for the list and table may be requested at slightly different times as the page auto-refreshes.
Expected errors
Reduce noisy errors by marking them as “expected errors”. Such errors won't affect reported error rate or Apdex metrics. For more details, see Manage errors.
Expected errors aren't shown by default on the Group errors tab. You can show them by turning on the Show N expected errors switch below the Group by bar.
Errors outside transactions
Using the New Relic agent API, you can record custom errors at any point in the execution of your code. Sometimes, such custom errors will occur when a transaction is not executing, such as in high-volume asynchronous code that doesn't handle an HTTP transaction.
Errors outside transactions are shown by default on the Group errors tab, but if you want to view only errors outside of the transaction, apply the following filter:
TransactionName = “Unknown”

Deletion of error traces
If you need to delete any sensitive information from the errors experience, we encourage you to submit a request to remove personal data.
Error data
Error data types: events and trace details
By default, our APM agents collect two type of error data: Events & Trace details.
Events
The error event data type includes default attributes, as well as any custom attributes instrumented in your service. It doesn't include a stack trace.
Events are subject to sampling (see Caps on error reporting and Charting error rates and counts). For more on error event data, see Events reported by APM.
Trace details
The trace details error data type includes stack traces and attributes, and supplements events with more data. It's expected that more events will be reported than trace details--see Caps on error reporting.
Show only errors with stack trace is enabled by default, to constrain the errors shown to just those that have this type of data collected.
This data is governed by specific retention rules for Error details.
Caps on error reporting
New Relic caps error reporting at:
- 100 events per minute per agent instance
- 20 trace details per minute per agent instance
These caps prevent error reporting from negatively impacting application performance.
Examples:
- App running across five EC2 instances, one JVM each. New Relic caps error reporting at:
- 100 events per minute x 5 instances = 500 events per minute
- 20 trace details per minute x 5 instances = 100 trace details per minute
- App running on one host with ten instances. New Relic caps error reporting at:
- 100 events per minute x 10 instances = 1000 events per minute
- 20 trace details per minute x 10 instances = 200 events per minute
Charting error rates and counts
The Error rate chart is driven by a query on metric timeslice data, which is an unsampled aggregate data type that is accurate but has very limited dimensionality. This data can't be faceted or filtered as flexibly as error event data.
You can reproduce this chart in a dashboard, or explore the metric timeslice data further by clicking the ... menu on the Error rate chart, and then using the View query or Add to dashboard options.
To chart faceted error counts using event data, as in the Top 5 errors chart, use an NRQL event query. Click the ... menu on the Top 5 errors chart and choose View query for a starting point in creating your chart.
Since event data can be sampled (see Caps on error reporting), you can use the EXTRAPOLATE keyword to get an accurate error count, even if sampling is occurring.
Report custom errors
You can report errors not collected by default with our agents using our agent APIs. For more, see the documentation on the API.
Ignore errors
You can prevent certain errors that would normally be reported to New Relic from being collected using our agent APIs or the server-side configuration UI. For more details, see Manage errors in APM.
Reduce noise with expected errors
Sometimes you want to collect error data, but not have those errors wake you up through alerts. Using the agent API, you can mark such errors as “expected”. They'll still be visible in the Errors page, but won't affect your service's error rate or Apdex metrics.
Disable error traces
To prevent certain errors from being reported to New Relic, disable them in your agent's configuration file. For most agents, you can ignore certain error codes or disable errors completely. For more information, see your specific agent's configuration documentation: