Errors inbox provides a unified error tracking experience to detect and triage errors:
- View and triage issues across applications and services that your team cares about for faster error resolutions.
- Proactive notifications with detailed error information in Slack.
- Error profiles to show similarities between error events and surface the root cause by analyzing attributes.
- Analyze errors in context of the full stack and resolve errors with precision.
- Errors for , , , and AWS Lambda functions are all captured in the same inbox.
Ready to get started? See our docs about creating your first workload.
Monitor errors
Once you've set up your errors inbox, you can begin proactively monitoring all errors in your stack:
Error groups
Error groups are sets of events that make up a unique error. Error groups are stored long term and contain metrics, activity log, discussions, and basic information about the unique error. Error groups are tied to the entity, so making a change to the state of an error group in one errors inbox will impact all other inboxes that contain that entity.
How error groups work
Error events get grouped into an error group when they share the same fingerprint. As events are ingested by New Relic, we run the events through a set of managed rules that output a fingerprint. Every unique fingerprint has a single error group associated with it.
The New Relic managed rules normalize the error data, identifying and ignoring unique values such as UUIDs, hex values, and email addresses that would cause grouping "like" errors into unique groups. New Relic account ID, entity ID, error class, error message, stack trace, and exception are all data that can impact a fingerprint.
Do any of the following apply to your errors inbox today?
- Errors not grouped in a way that makes the most sense for your application.
- Multiple unmerged groups that you would like to see merged.
- A “noisy” inbox due to poor grouping that pushes you to exceed the daily limit of unique error groups.
- An error group in your inbox that contains unrelated errors.
Having well grouped errors helps the errors inbox better triage and diagnose problems in your system. While the errors inbox provides a set of default grouping, it's occasionally necessary to make adjustments.
There are two options for adjusting error groups: updating the error message using custom attributes or creating your own error groups.
Create your own error groups
Many of our agents now have a feature that lets your code look at an error and designate an error group before it's submitted to New Relic. The designated group is then added as the error.group.name attribute on the error event. To get started, check out the APM links below, or the browser agent docs, for information on how to specify a custom error group. This will ensure errors and attributes collected by the agents are preserved and grouped to your liking.
Supported APM agents:
Even if we don't support your language, you can still set error.group.name as a custom attribute. This signals to us that the event belongs to a custom group, but the events captured won't have other agent attributes.
Best practices for meaningful error group creation
While our managed rules are able to provide automatic error grouping based on a predefined set of patterns, it is impossible to recognize every possible combination. Thus, removing high variability values from error messages will guarantee that your errors are grouped correctly.
For example, consider these two error messages:
- "Parsing Error: you put 124 and that is not allowed"
- "Parsing Error: you put 456 and that is not allowed"
These error messages look similar but these error occurrences are less likely to be grouped properly due to numbers that are shorter than 4 digits (124). If there is additional information (e.g. SQL statements, ids, etc) you would like to include in the error message, it can be sent via custom attributes.
Our recommendations:
- Avoid using numbers less than 4 digits long inside the error message.
- Avoid including special character inside error message.
- Avoid including SQL statements inside error message.
- Avoid including stack trace in the error message. Stack traces will not be formatted when sent as error message, thereby will not work with the CodeStream integration
- Avoid including data that have high variability (ex: ids, dates, JSON). Users will be better served if these values were collected as attributes. These attributes can be viewed at the individual occurrence level as well as at the error group level in the Profiles dropdown.
- We caution use of dates/timestamps. Although we do catch and group some error messages that contain timestamps, we can't guarantee we will recognize every format.
Occurrences
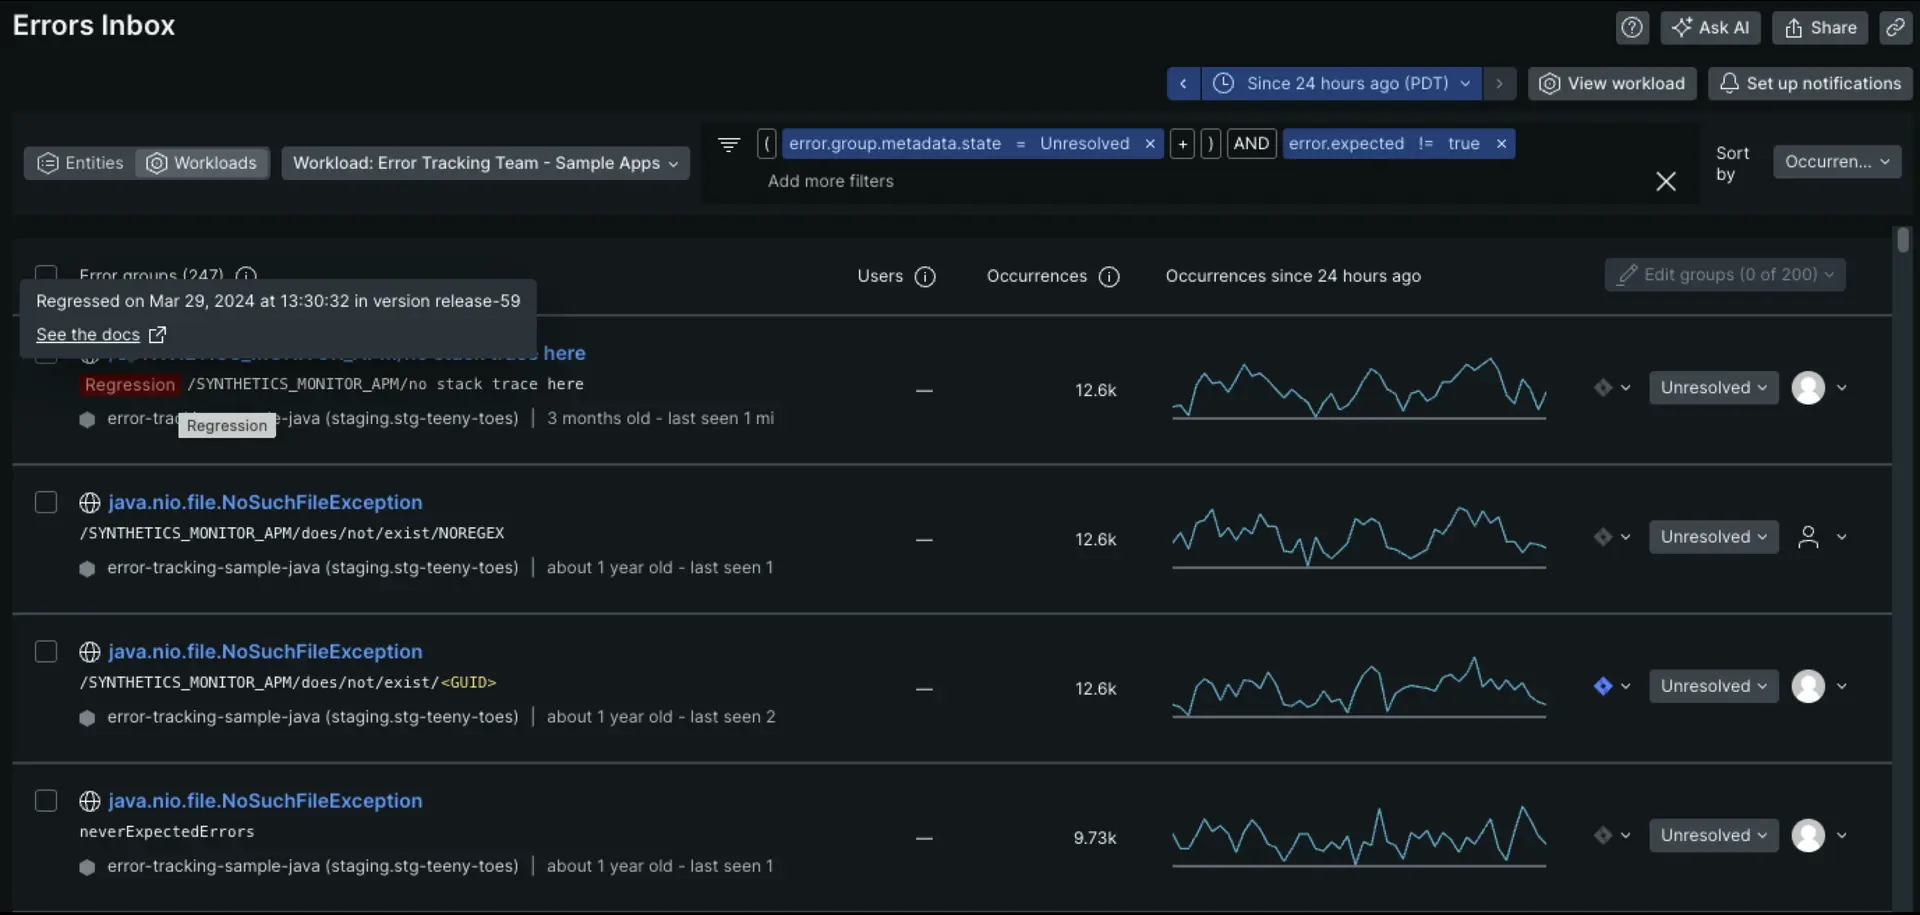
Your errors inbox displays the total number of occurrences of each error group within the selected timeframe. The corresponding sparkline chart displays the total number of occurrences per day over the selected timeframe as you hover over it.
Sort By filter
Using the dropdown in the top right, you can sort the list of grouped errors by the number of occurrences or by the error that was last seen in the time range selected. For example, if the time picker selected is Jan 24 5:00pm ET -- Jan 24 5:45pm ET and you sort by last seen, you will see error groups sorted with those containing the most recent occurrence first.
Regression tag
An error group is tagged with a regression tag when a new error matches a resolved error group's fingerprint. The regression tag will disappear once a regressed error group's state is changed.

Expected errors tags
An error group is tagged with an expected tag if all error occurrences in the group are expected. It is tagged with a contains expected tag if some error occurrences are expected and some are not. These tags are available on all errors after January 21, 2023.
See more on how to mark errors as expected.

Bulk actions

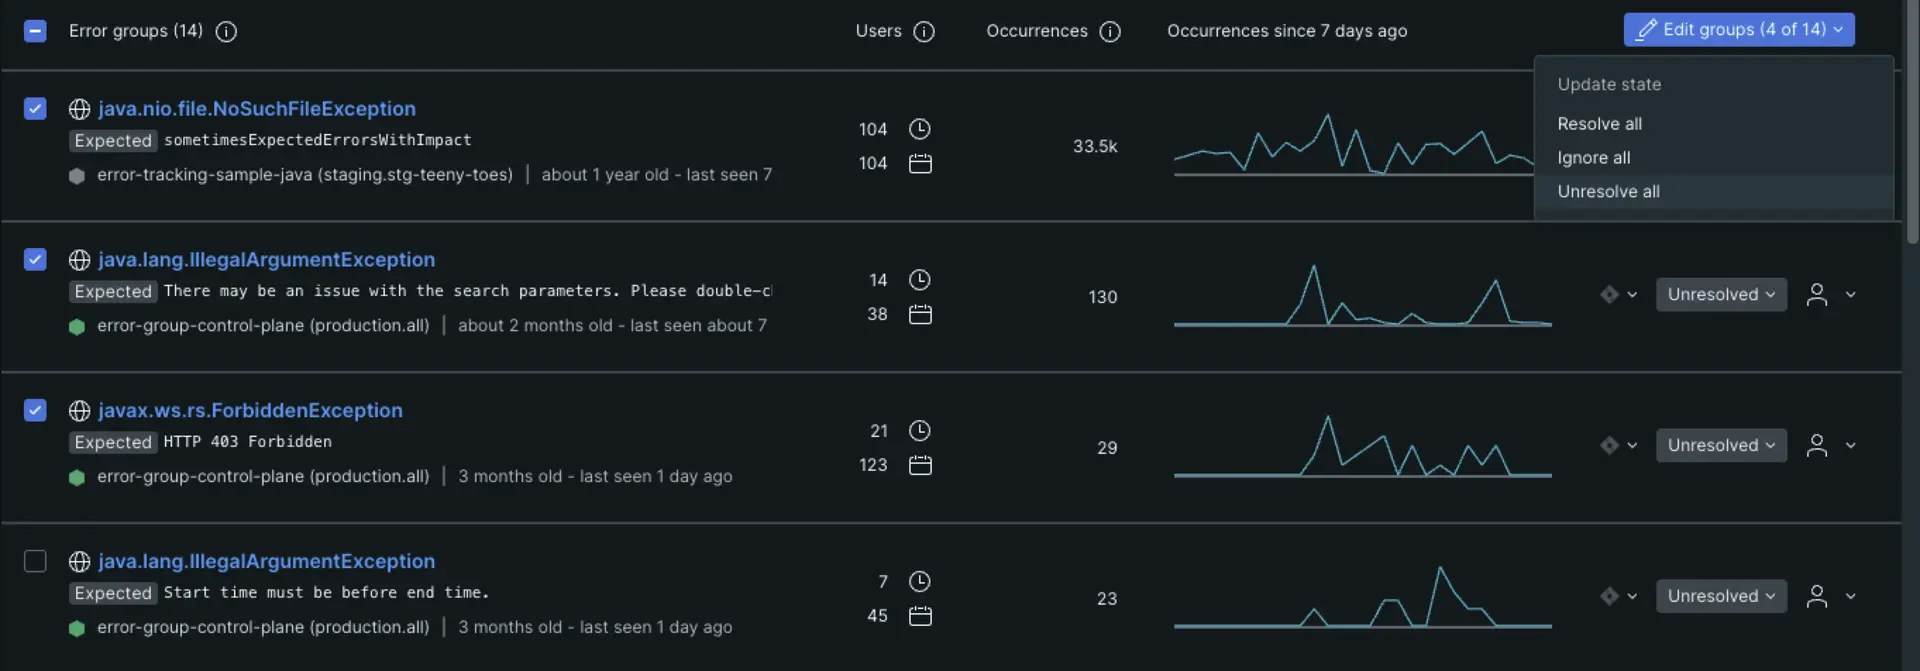
You can resolve, ignore, or unresolve errors in bulk with the Edit groups dropdown.
You can update the status of multiple error groups (up to 2,000) all at once. In the inbox view, check the Error groups checkbox to update all of your error groups in the inbox. You can also select individual error groups to update their statuses.
First and last seen dates
We understand it's very useful to know when an error group was first seen in order to correlate it with a change in the code/system. The accuracy of first and last seen dates depends on the three scenarios outlined below:
Scenario 1: If an error group was first created on or after 5/17/2022, first and last seen values are accurate.
Scenario 2: If an error group was first created before 5/17/2022, the first seen date will not be accurate. The first seen date is either 5/17/2022 or the date of the earliest occurrence (if the time window selected is before 5/17/2022). The last seen value will be accurate.
Scenario 3: If an error group occurs once per week or less, the first and last seen dates are estimates based on the time of the single occurrence. We only track first and last seen dates accurately for errors that show up more than once per week.
Triage errors
Errors inbox enables you to triage error groups directly from the main screen or from the error details page. Triaging helps remove the noise from your errors inbox, and lets you focus on the high impact errors that need attention.
Errors status
When you triage your inbox, you can choose from a variety of statuses. You may choose to resolve errors immediately or even mark them so they are ignored. In other cases, you may want to resolve issues in the next version or in a specific version. For details on the resolution options, see Version tracking.
Expected errors
Errors inbox enables you to filter out expected errors for APM entities. You can mark errors as expected, and filter them out of your inbox to remove noise.
- error.expected != true: This is the default. It hides all error groups that have only expected errors and it marks error groups that have a mix of expected and unexpected errors with the "Contains expected" tag.
- error.expected = true: This filter will show error groups where some or all errors in the group are expected. This can be useful for identifying which errors are marked as expected.
- Removing the error.expected filter will show all error groups whether they contain errors that are marked as expected or not.
- Expected errors are always removed from notifications.
- All of the features above as well as the expected errors tags are available on errors after January 21, 2023.
Error details
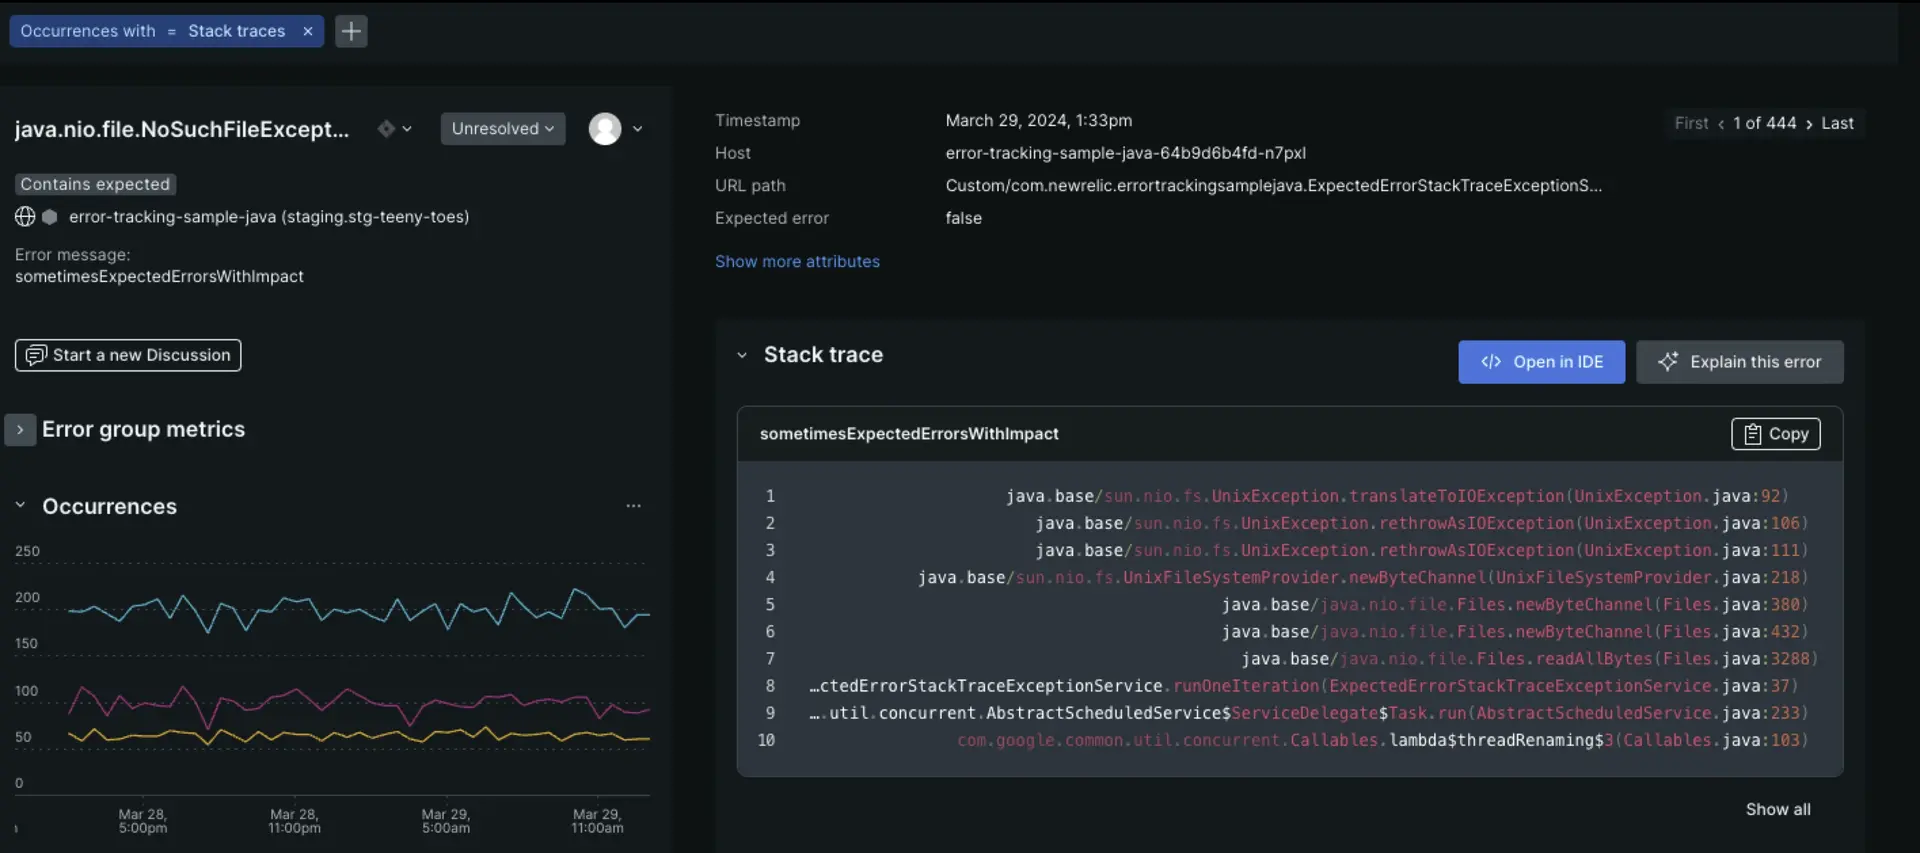
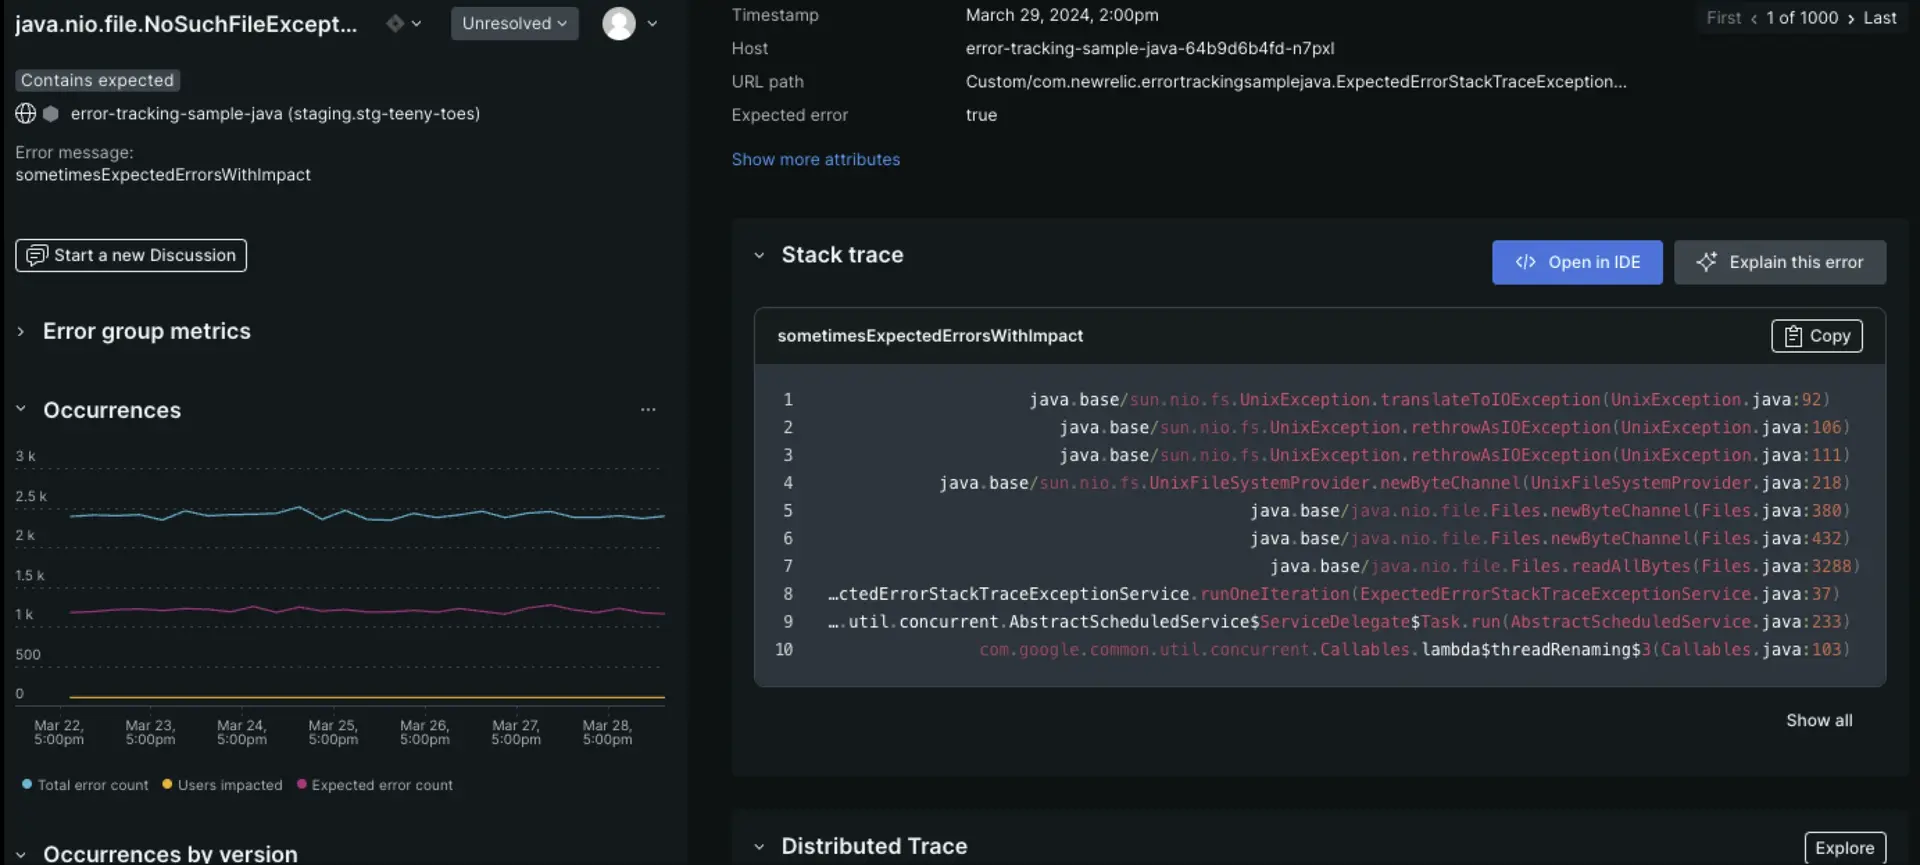
From errors inbox, if you click into a specific error group, you'll see a pop-up view showing the full context of the issue.

In the left-hand panel, you can find details for an aggregation of all occurrences of that error:
- Metrics: Number of users impacted, first seen, last seen
- Occurrences: How many times the error occured over the last 30 minutes
- Occurrences by version: How many times the error occurred per deployment version
- Profiles: Impacted attributes (click into a profile for an analysis)
In the right-hand panel, you can find details for a single occurrence of that error:
Number and frequency of errors
Related accounts
Stack traces
A list of error attributes
From the detailed view, you can cycle through specific errors using the toggle in the upper right to navigate between the first instance of the error, the last, or any instance between.
If you've set up distributed tracing, and if there are sampled traces related to errors, you'll see options to view trace details. This is a quick way to view trace information without going to the main distributed tracing page:
In the left pane labeled Distributed traces, you can expand the heading to show a list of all traces associated with errors in this error group. Alternatively, you can click Explore all to open a list of all the traces.

In Distributed trace, you'll see the trace that's associated with the error occurrence displayed on this page. To see the trace's spans in a waterfall view:
Click directly on the trace name, or click the icon with an arrow on the right. This pens up the waterfall focus view that highlights trace spans with errors.

Click Explore to open an unfiltered waterfall where you can click through all the spans.
Assign errors
You can assign an error group to anyone. Simply select the user from the assign dropdown menu. You may also assign an error to any email address, even if they aren't a New Relic user.
You can update the filter in errors inbox to show only errors assigned to yourself, or a teammate.
User roles in errors inbox
Standard role restrictions (read-only, standard, etc.) are only enforced in the error group comments feature of errors inbox. Outside of the comments capability, role restrictions are not enforced. Therefore, a read-only user has the ability to assign an error group within an account, outside of the account, and update the states of the error group (such as ignored, resolved, unresolved).