With Group errors tab, you can dynamically filter and group errors for deeper analysis. Group errors shows you where your OpenTelemetry errors are happening, and provides tools to help you determine the root cause.
The following spans will display as error events in the errors inbox UI:
otel.status=ERRORandspan.kind=serverorconsumerotel.status=ERRORandkind=serverorconsumer
These spans are treated as an individual error instance.

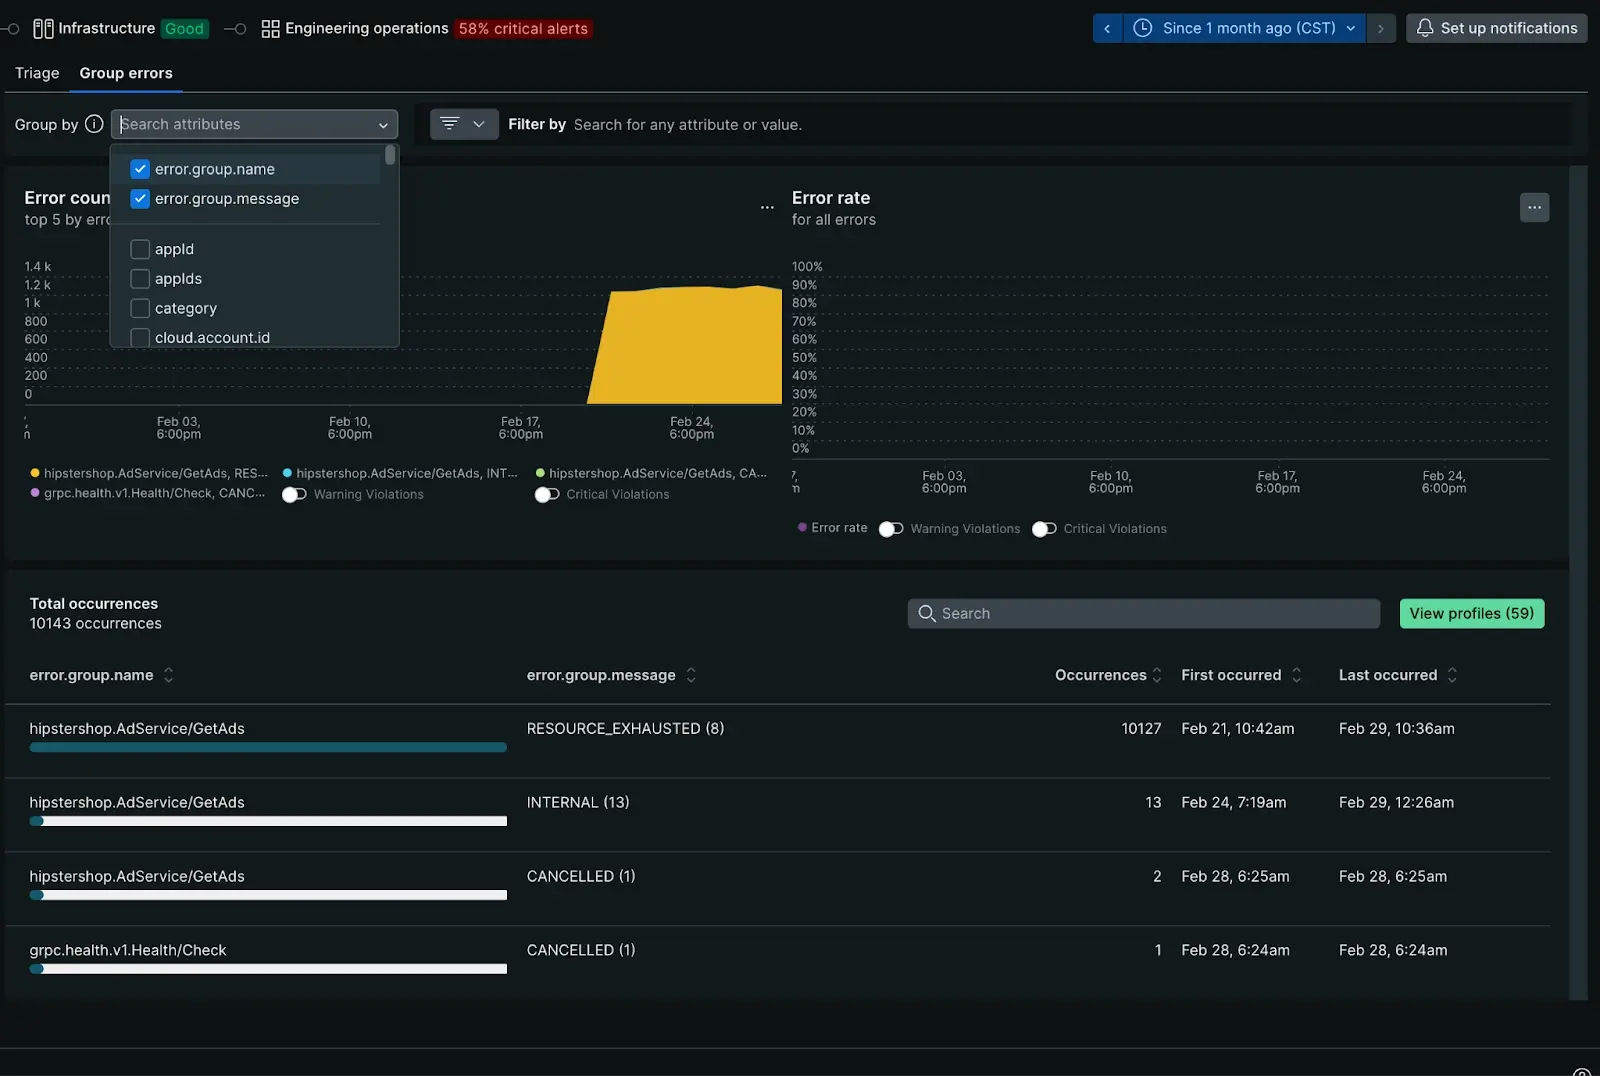
Go to one.newrelic.com > All capabilities > APM & Services > (select a Services - OpenTelemetry app) > Errors (errors inbox) > Group errors to see your OpenTelemetry group errors.
Errors list view
Start with the error rate charts to see at a glance whether there are any unexpected spikes, dips, or patterns with errors in general. You can correlate any general pattern on the top five errors chart alerts that occur during the same period.
- Dynamic grouping: The default grouping for error occurrences is based on
error.group.nameanderror.group.message. You can change the grouping options by any attribute, up to five attributes at a time. - Filtering: Many New Relic customers instrument custom attributes. Filtering on a specific custom attribute can quickly cut through the noise of all error occurrences.
Error profiles
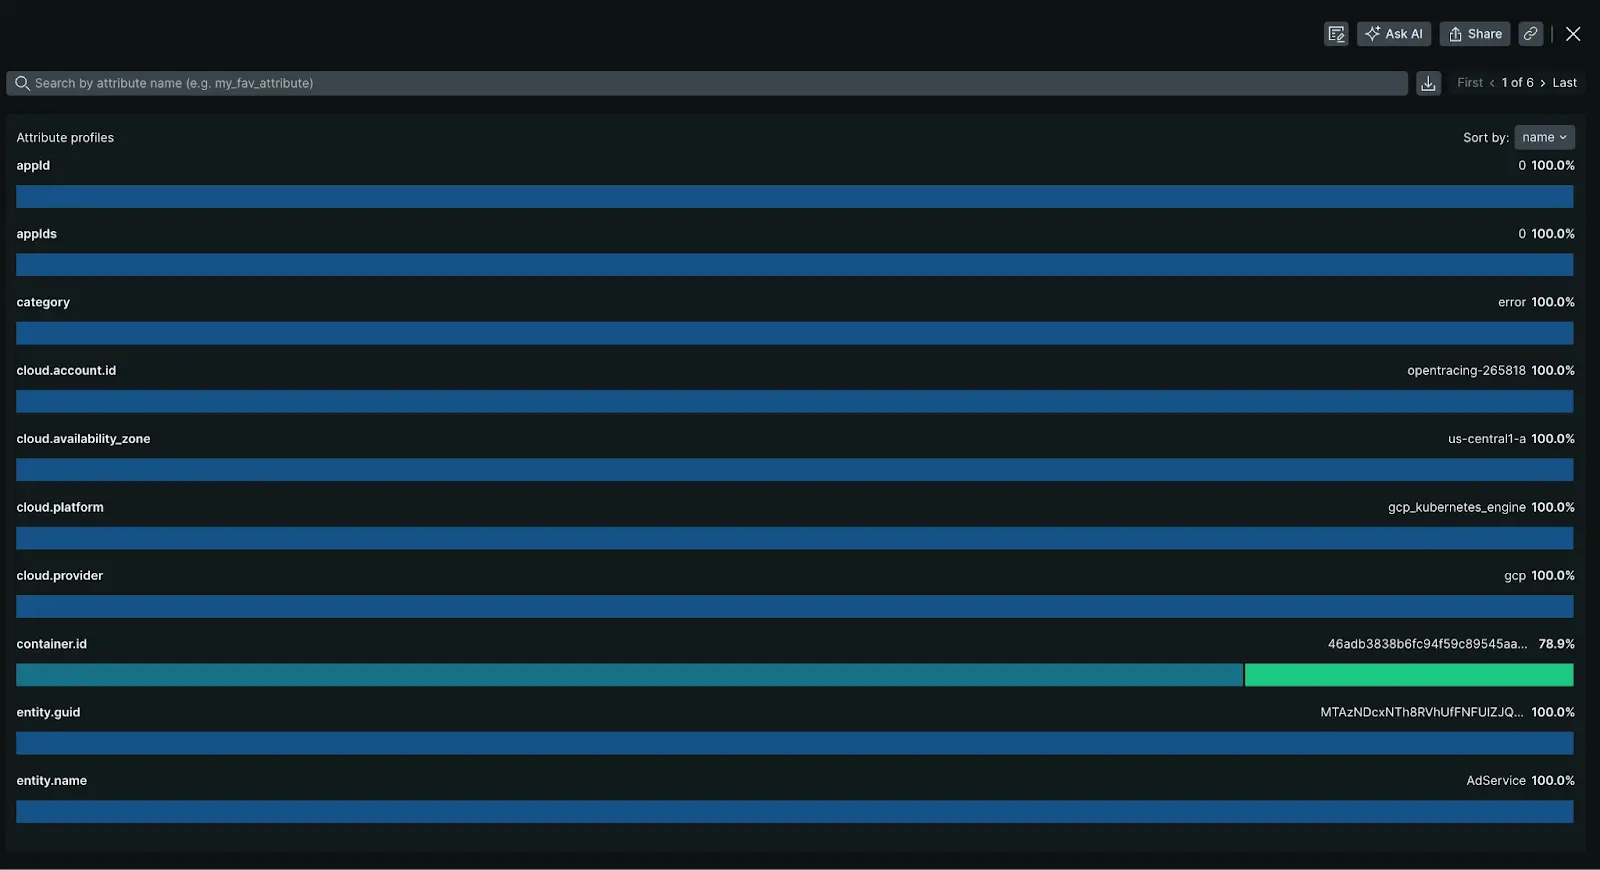
Error profiles reveal frequently impacted users during a designated time frame. You can download user attributes as CSV or explore detailed breakdowns by selecting individual rows. Leverage these insights to prioritize bug fixes and improve application stability.

Go to one.newrelic.com > All capabilities > APM & Services > (select a Services - OpenTelemetry app) > Errors (errors inbox) > Group errors > View Profiles to view your OpenTelemetry error profiles.
Error details view
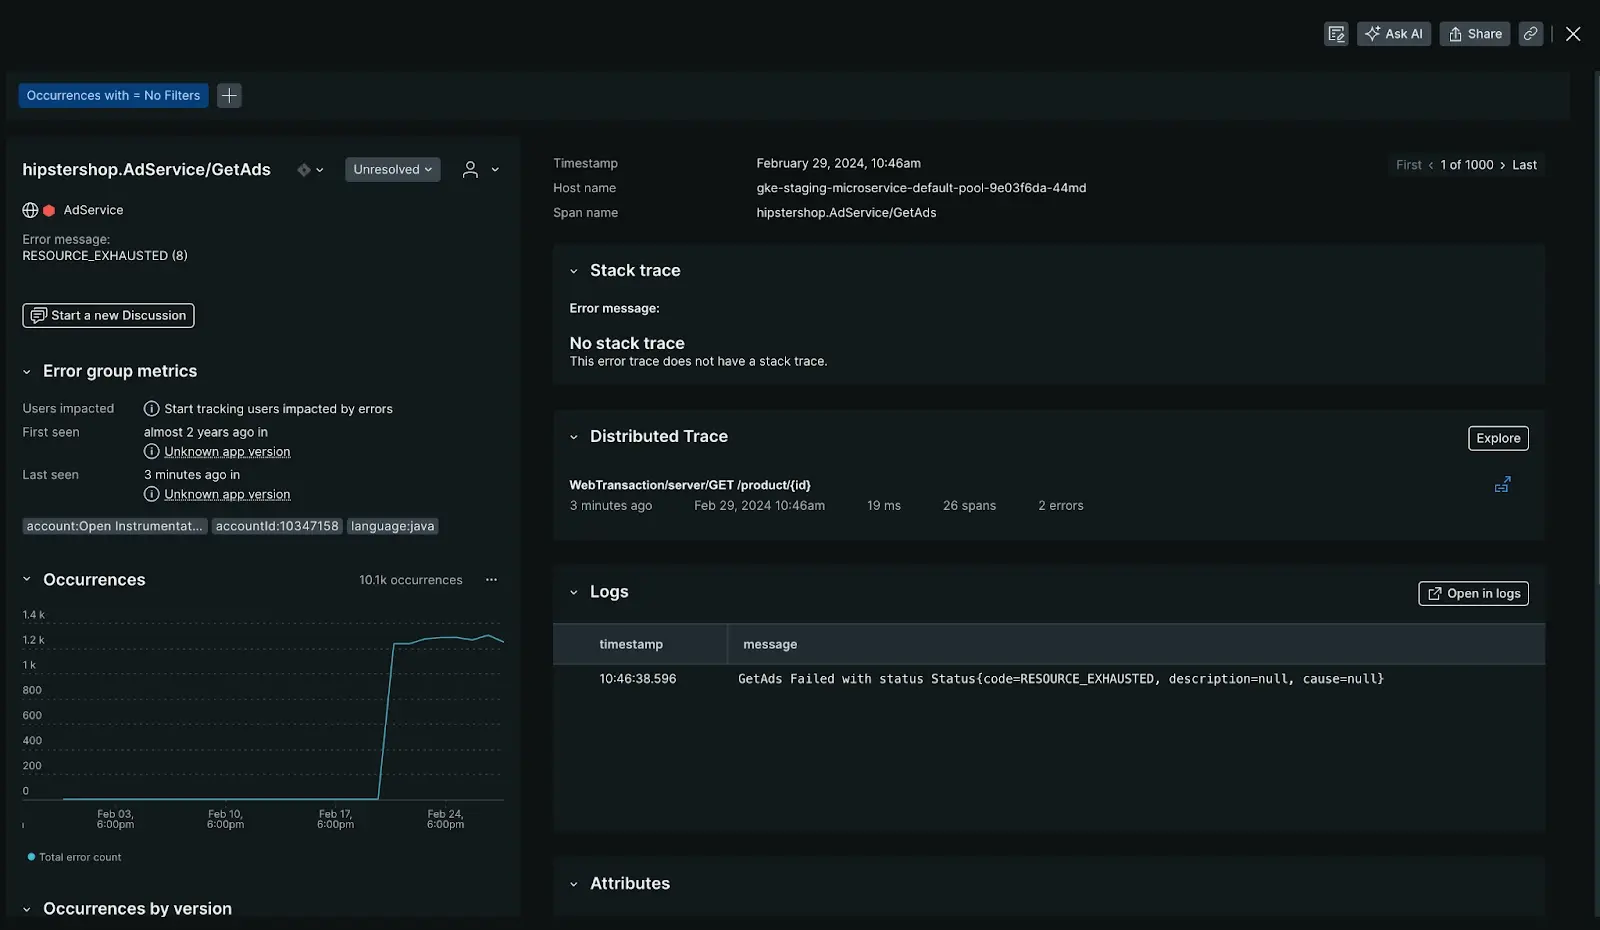
This page allows you to explore individual error groups, each representing a unique set of error instances with a shared fingerprint. For instance, if you encounter an error spike from a specific group of hosts, the detailed view provides context-rich insights. You can then navigate through specific instances within the group using the toggle in the upper right corner, allowing you to examine the first, last, or any intermediate occurrence.
Occurrences tab
The Occurrences tab includes not only error frequency, occurrence details, and stack traces, it also includes triage information.
Triage section
The triage section links the specific error occurrence to a system-created error group with a unique fingerprint. Using a unique fingerprint enables you to triage an error group using a status update or assignment. The system-created error groups are the ones you find on the Triage tab. For more info on how they're generated, see our doc on how error groups work.

Go to one.newrelic.com > All capabilities > APM & Services > (select a Services - OpenTelemetry app) > Errors (errors inbox) > Group errors > (click an error group) > Group errors details age to triage OpenTelemetry group errors.
Distributed tracing
If you've set up distributed tracing, and if there are sampled traces related to errors, you'll see options to view trace details. This is a quick way to view trace information without going to the main distributed tracing page.