Before using any tool, it's best to know how to use it. There's a process to creating, structuring, and writing queries with NRQL. Understanding the rules of querying with NRQL enables you to get the most from your data. Even if you've never queried anything before, just a basic understanding the rules allows you to access (almost) any data you need and visualize them in charts and dashboards.
Data exploration
One of the best ways to learn how to use NRQL is to access a New Relic query tool and use it to query your data. Here's an example of exploring your data using the query builder and the suggested entries from the interface.
Tip
Don't be afraid to play with your data! You won't break anything using any of our query interfaces, so feel free to tinker as much as you like!
The query begins with FROM followed by a space. The interface suggests available types of data, and you select Transaction from that list.

Next, choose an attribute using SELECT, and the query looks as follows:
FROM Transaction SELECTPressing space again causes the interface to suggest available attributes. In the example below, you choose appId.

This results in a very basic NRQL query using the required clause and statement (FROM and SELECT), and it provides a list of transactions and the associated appId for each, as shown below.

Another great way to explore your data is to go into any existing dashboards you have, click View query, and run your chart in the query builder.

Charts built with NRQL will have View query as an option. You can then edit and customize that query to see how your changes affect the resulting visualization.
NRQL query examples
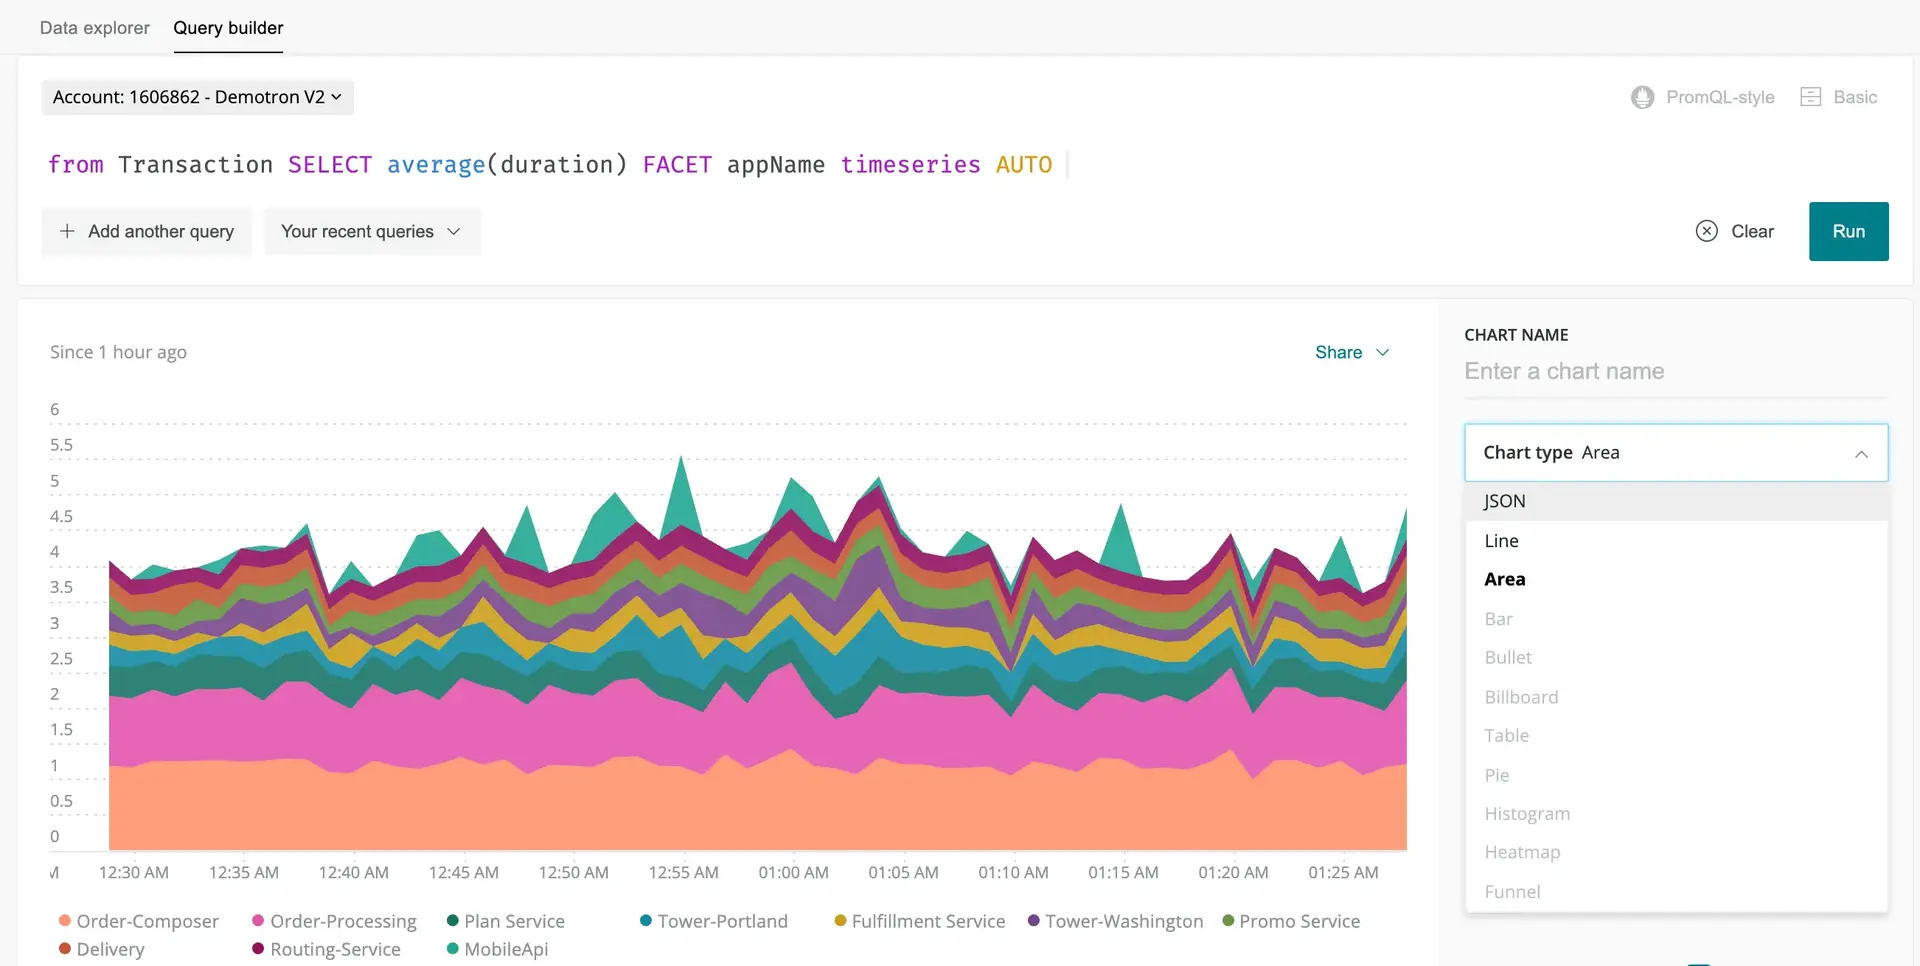
Here's an example of a slightly more in-depth NRQL query of Transaction data reported by APM. For this query:
- You choose
Transactionas the data type. - You use
Selectto determine the average duration. - You group results by appName using
Facet. - You use
Timeseriesto display the data over an automated timespan.
FROM Transaction SELECT average(duration) FACET appName TIMESERIES autoThis generates a chart that looks like:

Here are some more query examples:
Important
To explore your data without having to use NRQL, use the metrics and events data explorer. Learn more about querying data in New Relic.
Ready to learn more? Be sure to check out our introduction to NRQL if you haven't already, or learn how to use charts and dashboards with NRQL. If you want to start using NRQL right away, jump straight into our guided NRQL tutorial.