In digital business, systems are becoming increasingly large, complex, and interdependent. You may have hundreds of applications and services running at the same time, and you may need to monitor thousands of elements emitting data. In New Relic, we call those monitored data sources entities.
You can use our entity explorer, and New Relic Lookout and Navigator, to access and give context to the performance data from all your monitored entities. You can quickly see the entities related to a problem, exposing possible root causes and what other systems might be affected. Want to try it? Create a New Relic account for free, forever!
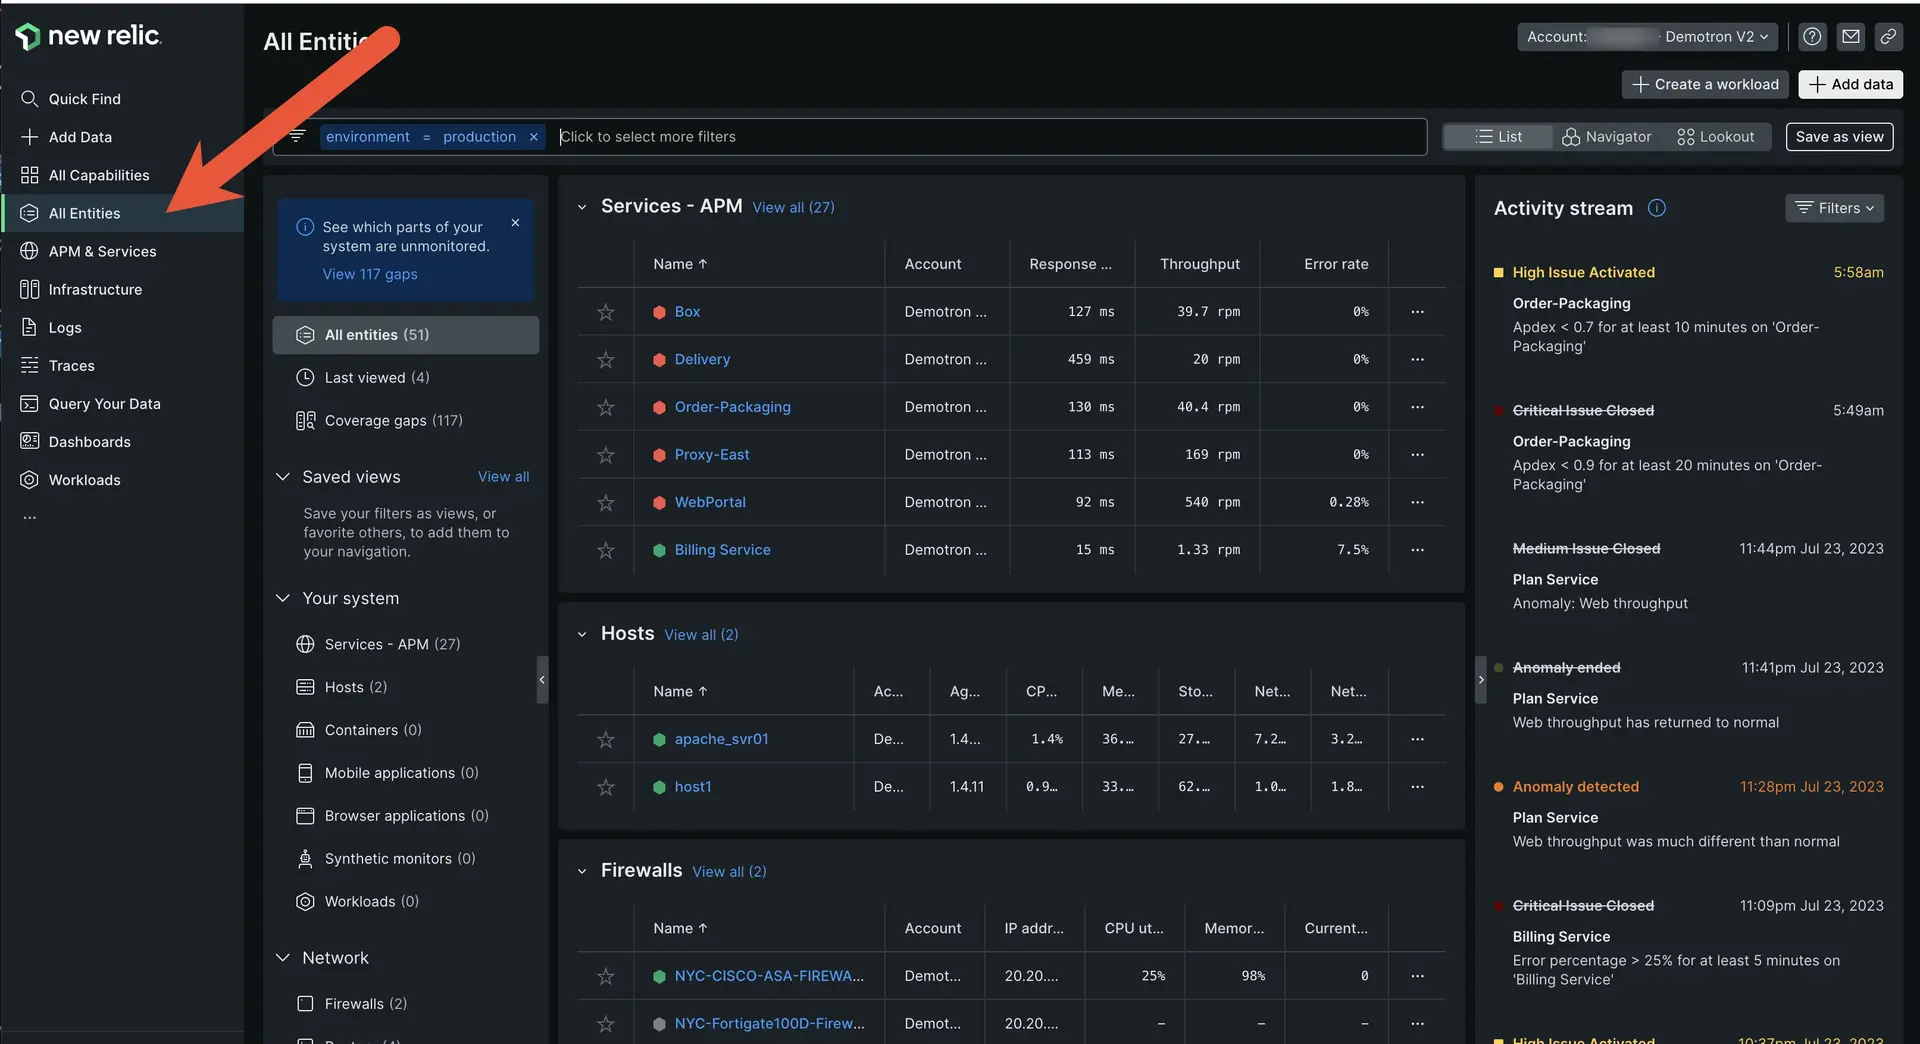
one.newrelic.com: When you open New Relic, you land on the All entities UI page, which gives you an overview of your monitored entities. From there you can switch to the New Relic Navigator and Lookout views, which highlight issues and changes in your system.
Tip
Want an introductory tour of our platform? See Get to know the platform.
Why it matters
With our entity overview experiences, you're more than just observing your metrics: You'll understand the root of what's happening, and not just the symptoms. You will:
- Gain extensive visibility of each monitored entity, its alert status, and how the entities are connected.
- See all your workloads, and create a new one in a click.
- Get a high level view of how your system's doing with the New Relic Navigator.
- Quickly grasp unusual trends and behaviors with New Relic Lookout.
- Filter and group related entities to quickly drill down to the issues.
The entity explorer
When you open New Relic, you'll land on the List view of the All entities page: this is also known as the entity explorer, because it's where you can find and explore all your monitored entities.
Your entities will be separated into a few categories. If you have many monitored entities, the list view may only show you a few entities per category, highlighting those where we detect issues.
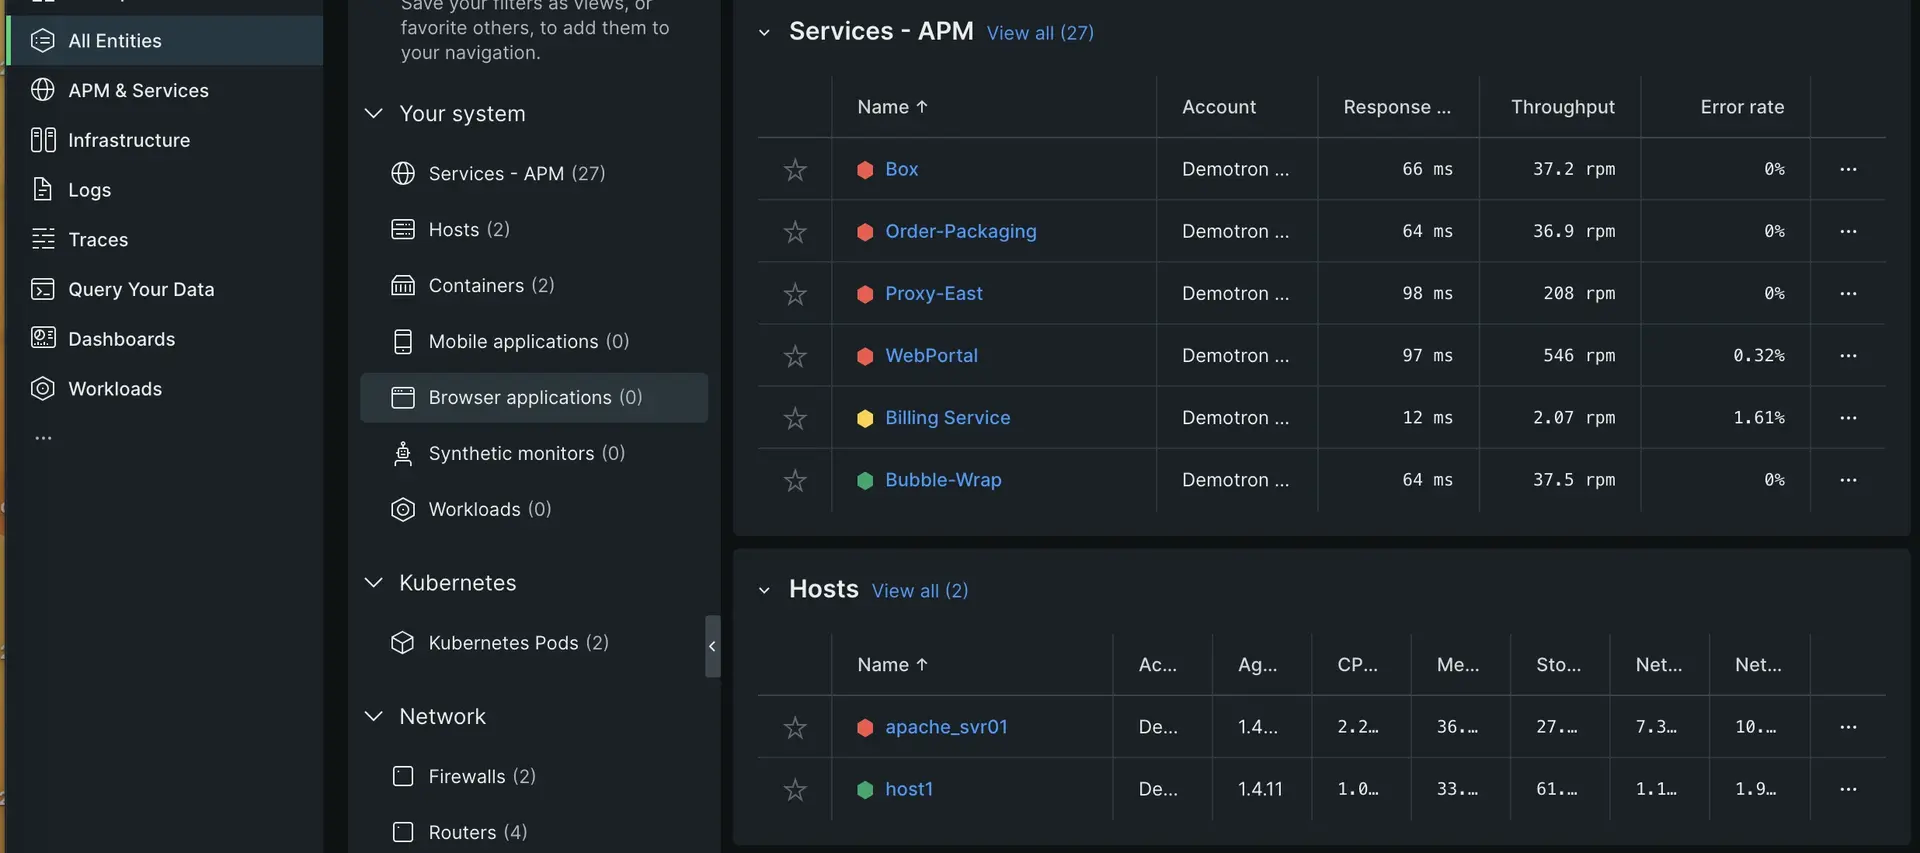
Here are some details about the entity categories:
- Services: APM-monitored applications and services monitored.
- Hosts: your monitored infrastructure (your servers and hosts).
- Mobile applications: your mobile apps.
- Browser applications: your frontend browser apps.
- Integration-reported data: data from services monitored by our integrations, including our on-host integrations (like Kubernetes, StatsD, and NGINX), and cloud platform integrations, like Amazon, Microsoft Azure, and Google Cloud Platform (GCP).
- Workloads, your customized entity groupings.
- Containers, such as Kubernetes or Docker.
- Synthetic monitors, for simulations.
Tip
You can create new entity types to monitor any data source. Learn more about entity synthesis.
From this UI, you can use the following features:
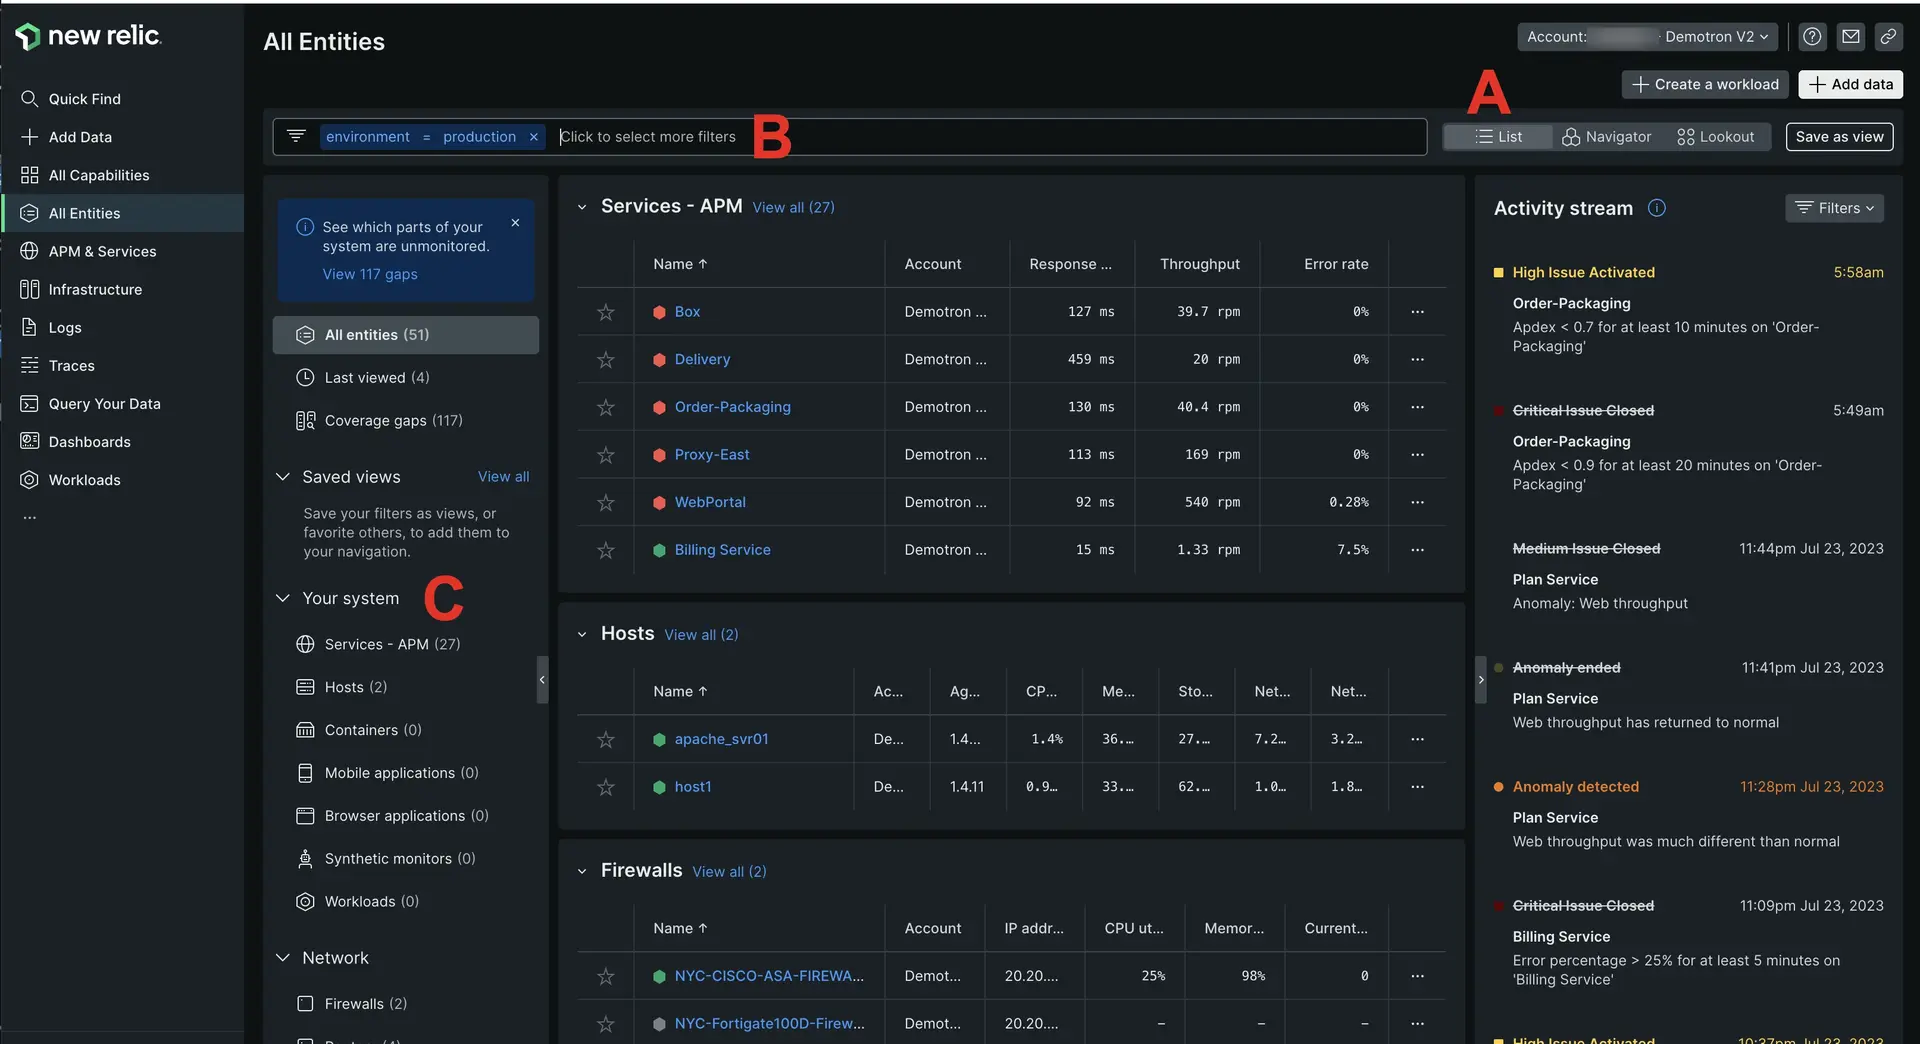
one.newrelic.com > All capabilities > All entities: Use the entity list and explorer to locate and examine your entities.
- A. From the list view, you can switch to
- New Relic Navigator. This gives you a high density overview of all your entities, which helps you detect any issues and health patterns at a glance.
- New Relic Lookout: This helps you spot entities that have had recent changes in performance.
- B. Entity filter bar: Filter to the entities you want to examine, and save filtered views you like for later use.
- C. Your system: Explore the different categories of monitored entities by scrolling in this sidebar.
Filter your entities
The entity filter bar is available on the All entities view, and in many New Relic experiences, including , , infrastructure monitoring, and more. To learn how to filter your entities, and save filtered views, see Filter entities.
New Relic Navigator
The New Relic Navigator makes it easy to explore large numbers of entities as it intuitively displays the entire estate of your system in a highly dense honeycomb view with traffic light colors based on alerts.
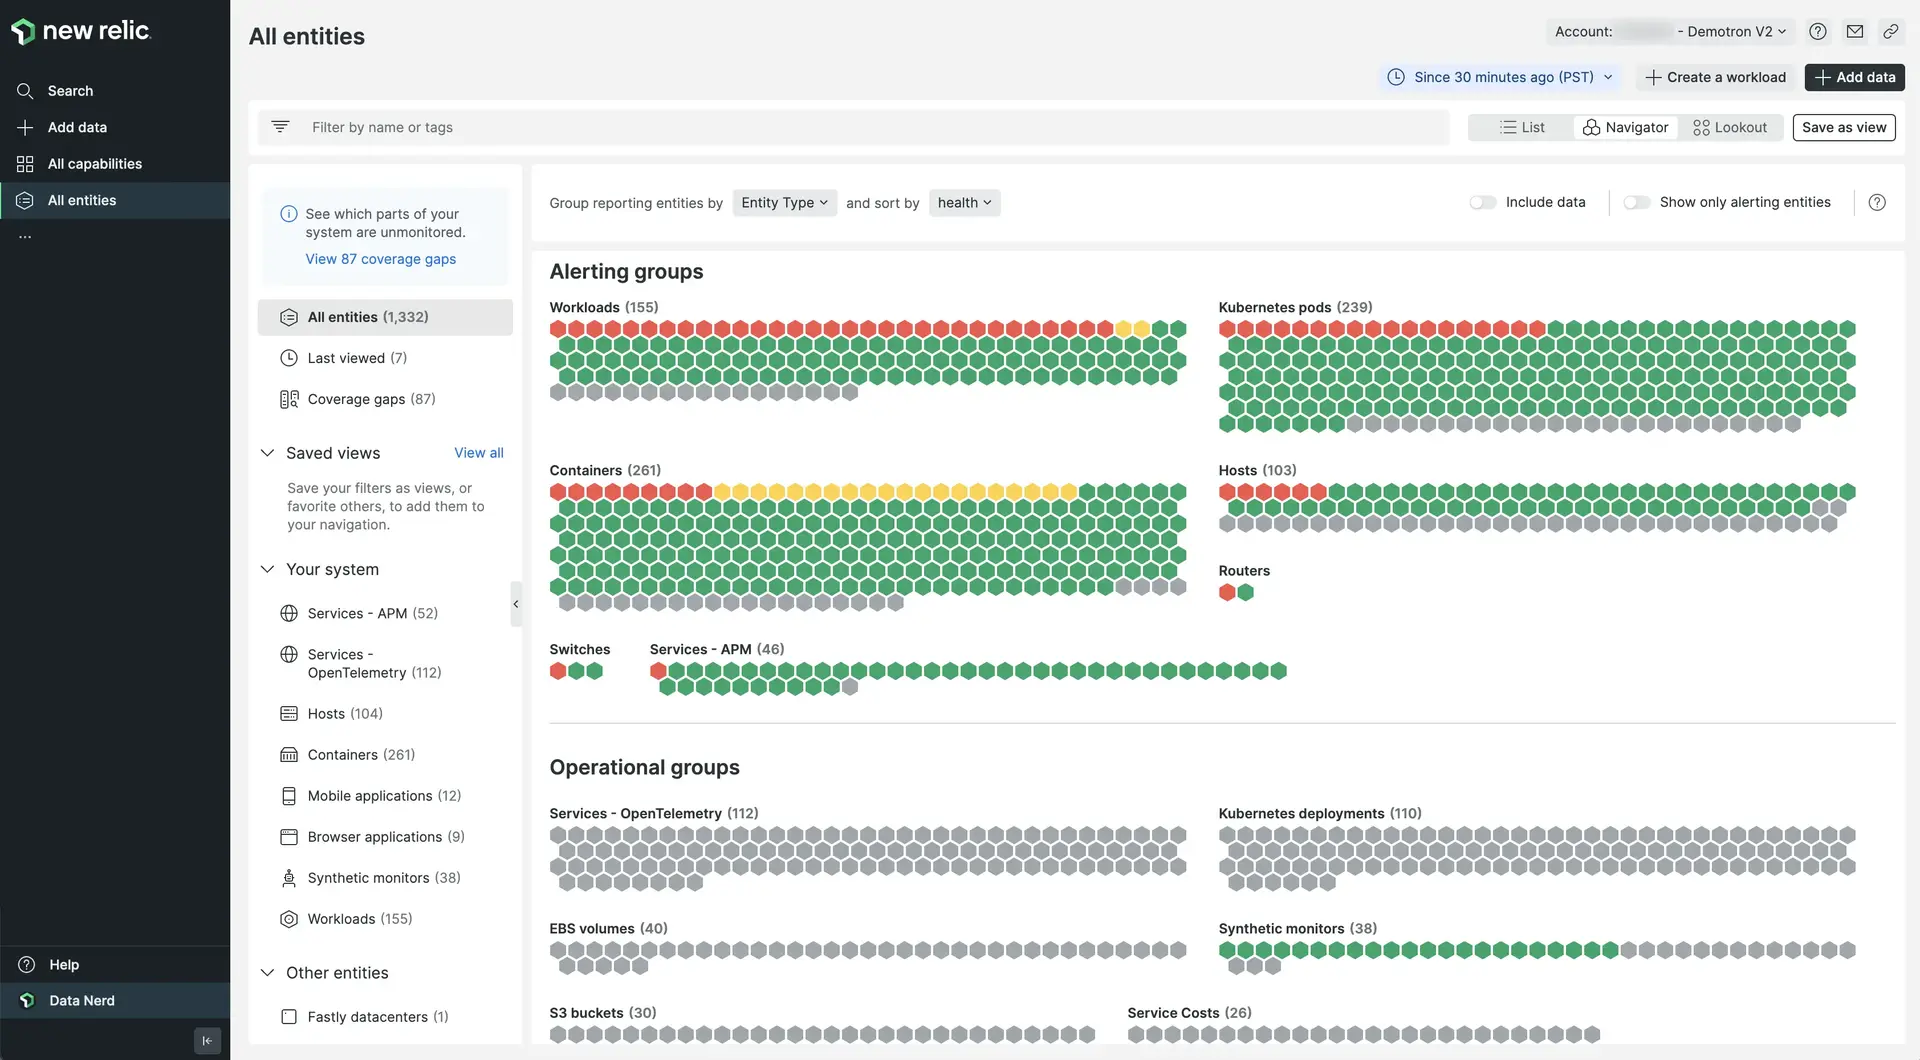
With the New Relic Navigator you can:
- Quickly explore the health of your environment at a glance.
- See all the entities that belong to all your accounts, and focus on specific entity types or specific groups of entities grouped by tags.
- Group and filter across all your entities to quickly zero in on issues.
- Click on any entity to see a mini-overview of its activity, metrics, and metadata.
New Relic Lookout
New Relic Lookout provides an intuitive view of entities that are deviating from normal behavior, using circle visualization with color indicating severity and size conveying the scale of recent changes. You don't need to configure anything: New Relic Lookout automatically compares performance within the last five minutes against the previous hour.
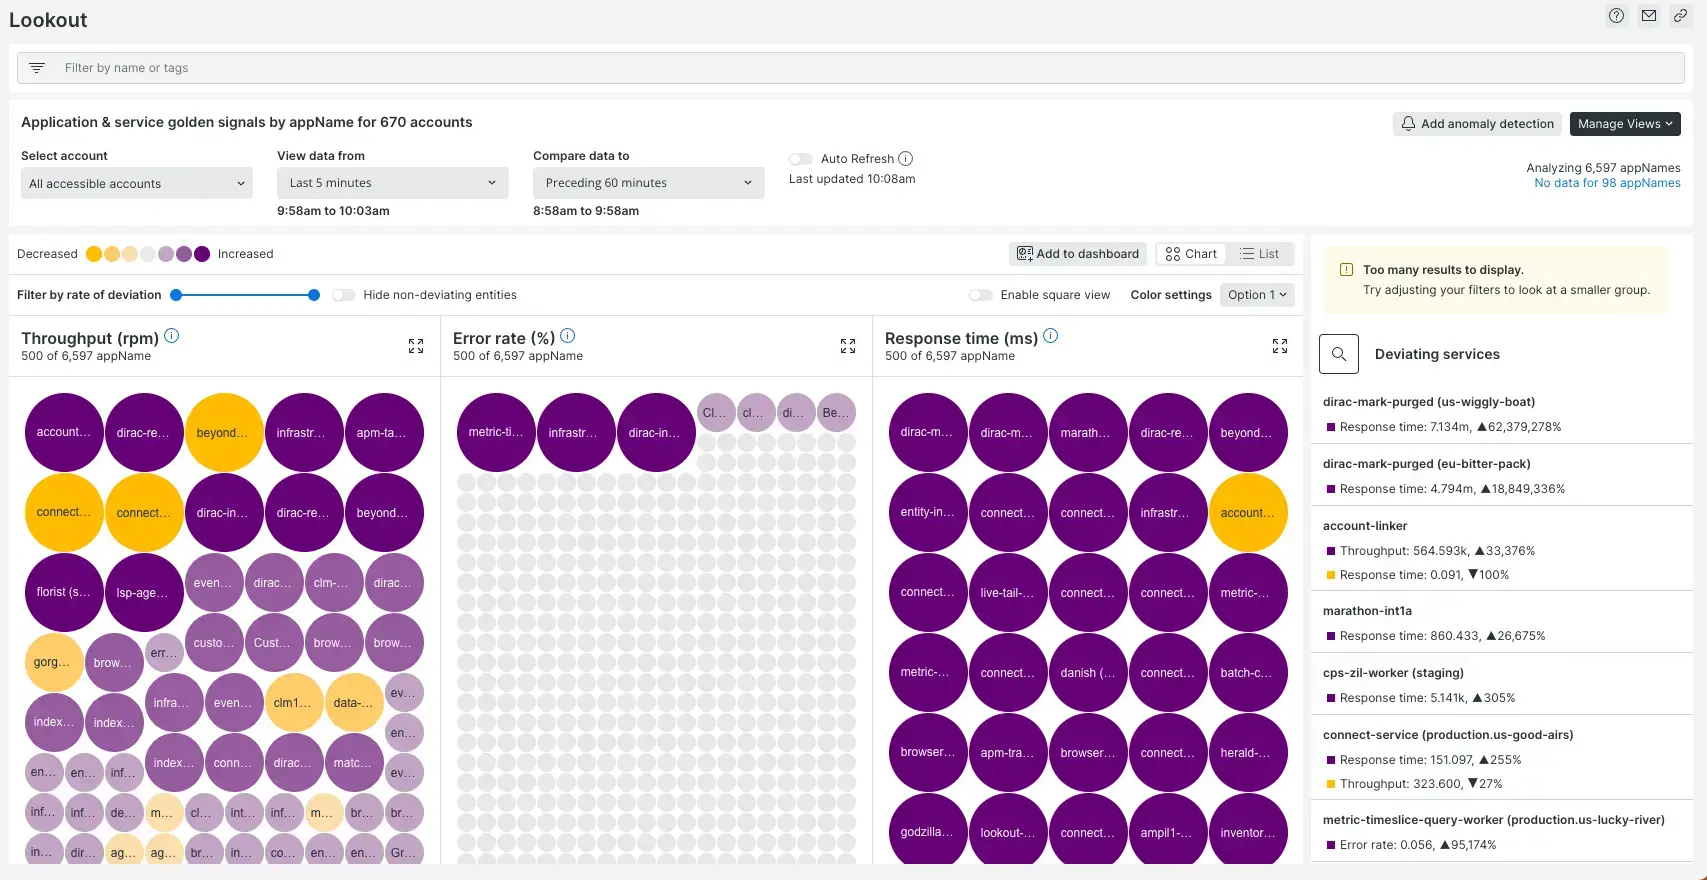
Use New Relic Lookout to:
- Select the entity type to see golden signals of throughput, response time, and errors across all your accounts.
- Zoom in with correlations, abnormal history, traces, and the ability to leverage New Relic's profiles across your estate.
- Click on an entity of interest to access the mini-overview component.
To learn more, see New Relic Lookout.
Tip
You can modify the color palette to focus on clusters of interest.
Understand the state of your system with the health (alert) status
The New Relic platform uses a color-coded health status for entities. For example, you may see a red alert status indicating a critical incident in progress.
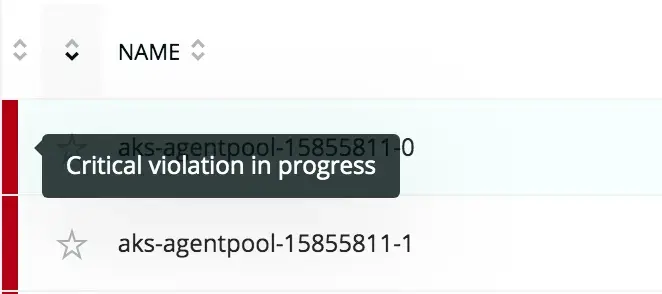
- To see what an alert status means, mouse over it.
- To see details about an entity's alerting status, select the entity.
NRQL alert conditions aren't used to determine alert status because they aren't associated with specific entities.
Entity data retention
Availability of data depends on these factors:
Scope | Data retention |
|---|---|
Entity explorer and search | In the entity list, data is available for eight days after an entity no longer exists, with one exception: data reported by integrations, such as Amazon AWS, is only available for one day after an entity ceases to exist. |
Our database (accessible via NRQL query) | For querying our database (for example, via the query builder or metrics and events, availability is dependent on the data retention for that data type. |
As a result of these factors, a short-lived entity (like a cloud host) may not be available in the explorer list or via search, but its data may still be available via NRQL query.