OpenTelemetry is a toolkit to gather telemetry from applications, infrastructure (hosts, Kubernetes, etc.), and more. By integrating OpenTelemetry with New Relic, you can leverage a wide range of platform capabilities to analyze the data and diagnose problems.
This documentation provides a foundational understanding of OpenTelemetry and its integration with New Relic. For practical guidance on implementing common use cases, such as Application Performance Monitoring (APM) and infrastructure monitoring, see Get started with OpenTelemetry and New Relic.
To delve deeper into how New Relic processes and ingests OpenTelemetry data, explore the following pages:
- OpenTelemetry data in New Relic: Learn how New Relic receives, processes, and ingests OpenTelemetry data
- New Relic OTLP endpoint: Configure our OTLP endpoint to send data to New Relic
For details on the support New Relic provides for OpenTelemetry, see OpenTelemetry support.
Benefits of OpenTelemetry
OpenTelemetry is a vendor-neutral open standard for instrumenting and exporting telemetry data. The project scope is quite extensive, including:
- A specification of language agnostic APIs for instrumenting the core pillars of observability (traces, metrics, logs), and SDKs for configuring how telemetry is exported out of process, with implementations exist in 11+ languages. There is a substantial catalog of instrumentation available built on top of these APIs.
- OTLP, a general-purpose telemetry data delivery protocol.
- Semantic conventions describing the shape of telemetry data for common domains (HTTP servers, messaging systems, and many more).
- The Collector, a highly configurable and extensible data collection and processing pipeline used to monitor infrastructure and enrich, filter, and otherwise transform telemetry.
These components work together to create distinct advantages described in the table below.
Feature | Description |
|---|---|
Language agnostic | OpenTelemetry reduces the cognitive load of polyglot teams by providing one vocabulary and one toolkit. |
Open standard | As an open standard with an open governance structure, no single vendor controls the direction of OpenTelemetry. |
Full control of observability data | The highly configurable and extensible nature of language SDKs and the Collector offer unparalleled control over your telemetry data pipeline. |
Rich instrumentation ecosystem | One of the goals of OpenTelemetry is for the APIs to ultimately be used directly in upstream libraries and frameworks. To bridge the gap, OpenTelemetry provides a large catalog of instrumentation contributed from engineers all over the world. There is more collective instrumentation effort in OpenTelemetry than any one vendor can provide on their own. |
Future proof | While OpenTelemetry has already come a long way, it seems poised to grow in adoption thanks to its large active community, industry support, and open governance model. While we can't see into the future, OpenTelemetry is the most likely open source winner in the observability industry. |
OpenTelemetry or New Relic instrumentation?
In many cases, there is overlap between features and components available from OpenTelemetry and from New Relic. For example, OpenTelemetry APM monitoring mirrors New Relic APM agents, and infrastructure monitoring with the OpenTelemetry Collector mirrors the capabilities of the New Relic infrastructure agent.
We recommend that you explore both New Relic and OpenTelemetry options. With New Relic instrumentation, there are inherent advantages to developing instrumentation and platform features which work together, and New Relic integrations tend to work better out of the box. On the other side, OpenTelemetry offers an unparalleled degree of flexibility and control, but this sometimes requires additional research and effort to achieve the desired outcome.
OpenTelemetry is continually evolving
The OpenTelemetry project has a large scope which has grown over the years. While many core components have reached stability (including OTLP, the trace APIs and SDKs, the metric APIs and SDKs, the log bridge APIs and SDKs, HTTP semantic conventions, and many language implementations), there are naturally pieces which are at various other stages of maturity.
New Relic aims to have first-class support for OpenTelemetry, including ingesting all OTLP data into our general purpose observability platform and building user experiences on top of OpenTelemetry data to help drive insights from the data out of the box. As components emerge and develop, our platform capabilities will evolve alongside. However, please be cognizant of the maturity status of any OpenTelemetry components you're integrating with. While we try to stay on top of changes, it can be challenging to build around breaking changes of experimental components.
OpenTelemetry reference architecture
With such a wide variety of components and configuration options, it can be difficult to know where to start with OpenTelemetry.
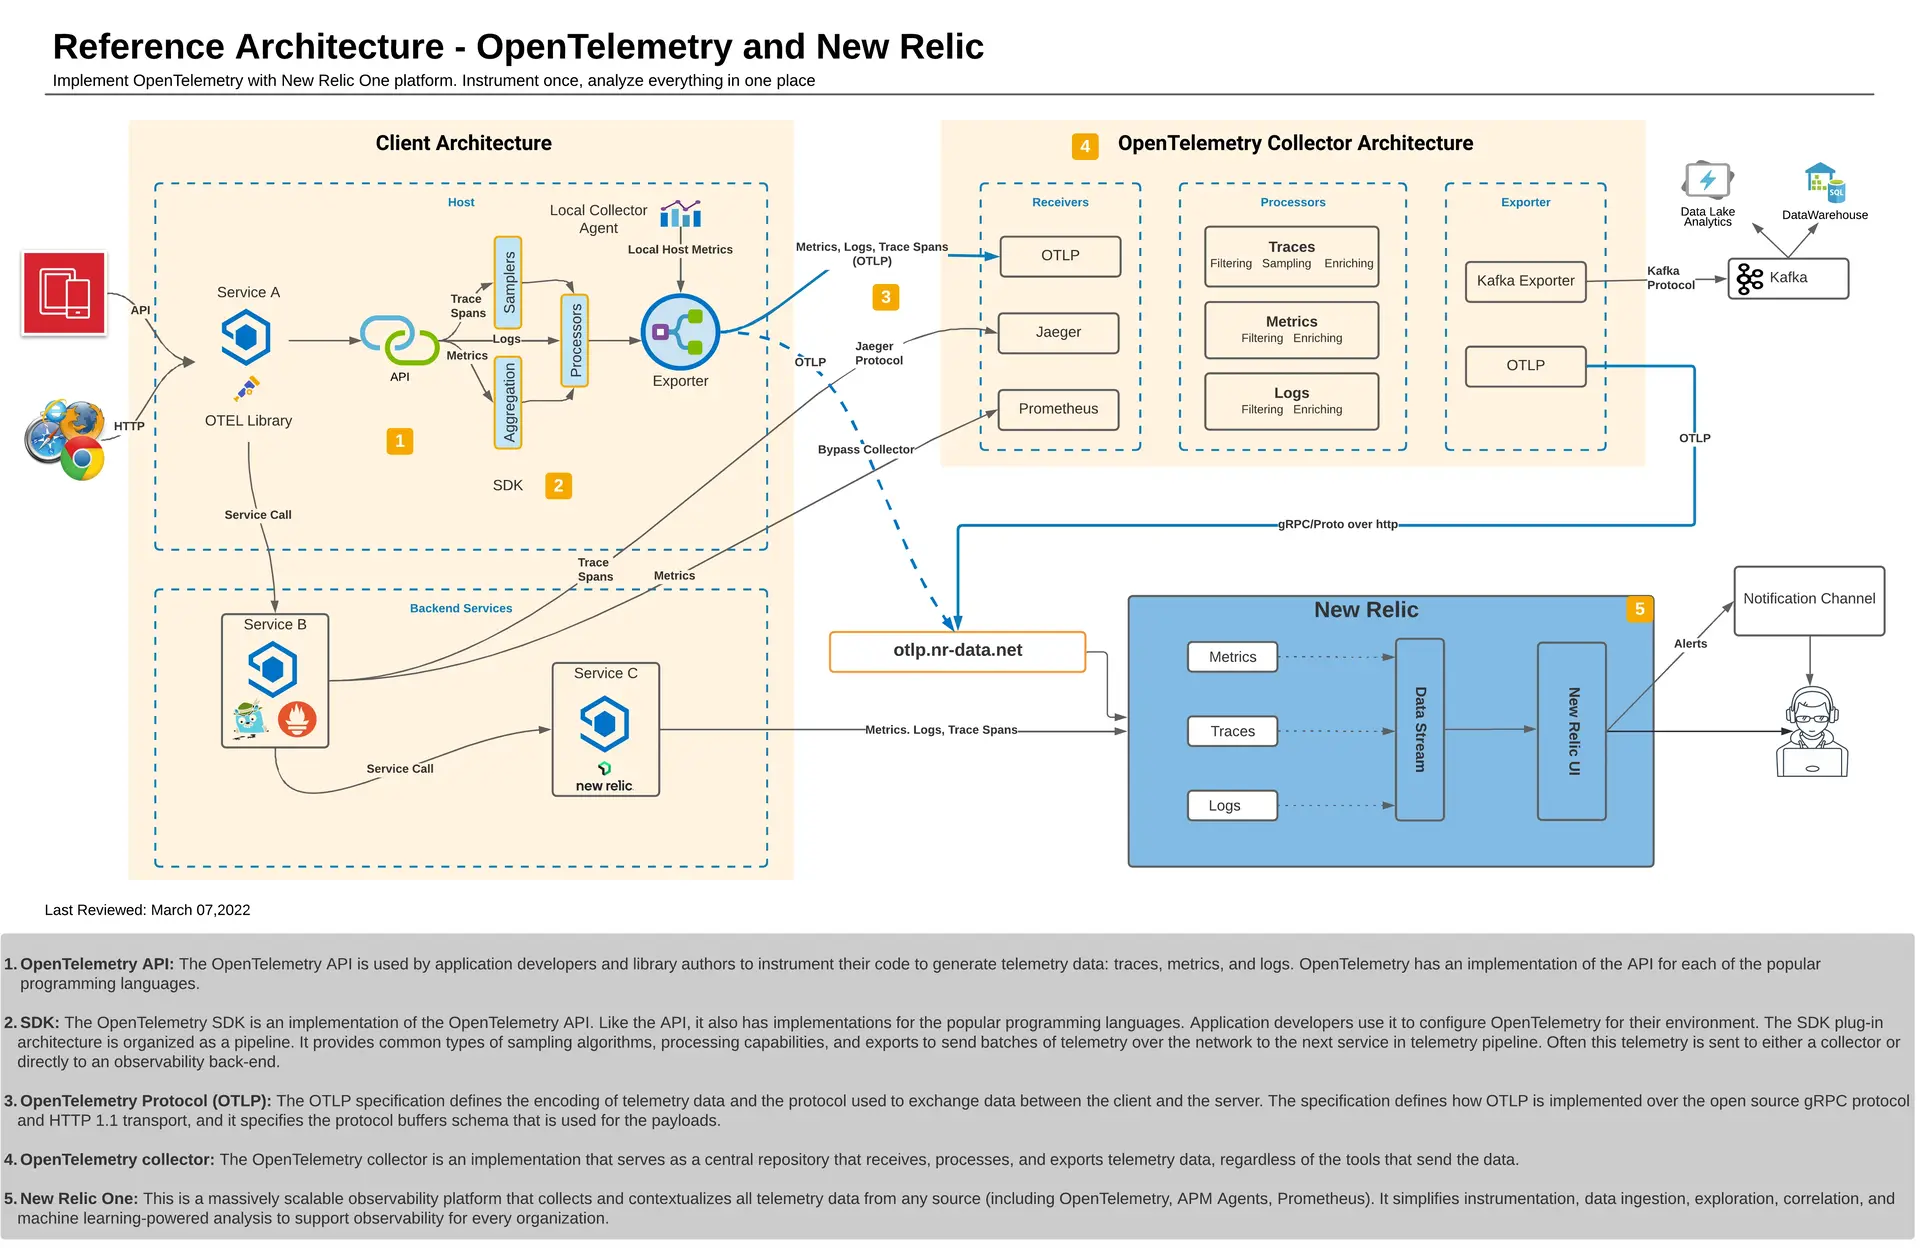
The diagram below showcases a reference architecture that provides a high-level overview of how various OpenTelemetry components interact and integrate with New Relic. This visual guide is valuable for software developers, DevOps engineers, architects, and managers seeking to align on key concepts.
The architecture illustrates applications instrumented with a diverse set of tools, including New Relic APM agents, OpenTelemetry APM instrumentation, Jaeger, and Prometheus. These tools collect telemetry data, which is then exported to New Relic, potentially passing through an optional, intermediate OpenTelemetry Collector. The Collector understands a wide variety of protocols, and can process, filter, and enrich telemetry data before exporting on to one or more destinations. For working code examples demonstrating these integrations, see Get started with OpenTelemetry and New Relic.

For additional reading, familiarize yourself with the OpenTelemetry demo, a project maintained by the OpenTelemetry community which illustrates various OpenTelemetry concepts through a fictitious ecommerce system driven by a series of microservices.