Cloud Cost Intelligence shows your cloud spend at a high level, such as your total AWS or EC2 cost. That view tells you how much you spend, but not what it costs to deliver a single unit of value from your service.
Unit economics closes that gap. It measures a business metric such as cost per query: how much it costs your business to run one query. When a cost goes up, a unit metric helps you tell the difference between two very different situations:
- Growth: Costs rose because you served more users or ran more queries. This usually reflects business growth.
- Waste: Costs rose while the work stayed the same, which points to an inefficiency to investigate.
Create a unit metric
To track efficiency, create a unit metric that connects your cloud spend to a business event such as a query or transaction.
- Go to one.newrelic.com > All capabilities > Cloud Cost Intelligence.
- Click Create unit cost to set up a unit metric that connects your cloud spend to a unit of business value, such as a query.
- In the Define New Unit Cost section, complete the following fields:
Field | Description |
|---|---|
Metric name (required) | The name of the business metric you want to measure, for example, Cost per Checkout. |
Unit (required) | The unit you're measuring against, for example, $/transaction. |
Description | An explanation of what this unit cost represents. |
Category | The category the metric belongs to, for example, Commerce, Infrastructure, or Kubernetes. You can add a new category if you need one. |
Benchmark / Efficiency Score | A target threshold for your unit cost, for example, 2.5. If your actual unit cost stays within this benchmark, your efficiency score is good. |
Define the cost and usage
Cloud Cost Intelligence calculates the unit cost by dividing one value by another. You define these two parts side by side:
- Cost Definition: The cost metric you want to measure, such as your spend.
- Usage Definition: The business metric you want to measure, such as the number of queries.
Tip
Use the switch button between the two panels to swap the numerator and the denominator. When you switch, the panel headers update to show which part is the Value Unit (Numerator) and which is the Cost (Denominator). This lets you measure either cost per unit (for example, cost per query) or units per cost (for example, the number of queries delivered for a given cost).
Cost Definition
Define your cost metric using either the Filters tab or the NRQL tab.
Filters
- Click Configure Filters and choose a filter source:
- Cost overview: Filter by cloud provider dimensions such as account, service, and region.
- Kubernetes: Filter by Kubernetes dimensions such as cluster, container, and deployment.
- Click Validate & Calculate Spend to calculate the matched spend for the selected date range.
- The Matched Spend value shows the monthly spend for your filters. Click Preview Spend to see the result.
NRQL
Use the NRQL tab to define your cost metric with an NRQL query instead of filters.
Usage Definition
Define your business metric using either Guided mode or the NRQL tab. Use the account dropdown to select the account you want to query.
Guided
Build the query step by step using the following fields:
Field
Description
Event type
The event you want to query.
Aggregation
The aggregation to apply to the results, for example, Count.
Where condition (optional)
Conditions that filter the results. Enter the conditions without the WHERE keyword, for example, appName = 'MyApp' AND duration > 1.
Facet (optional)
An attribute to group the results by, for example, appName.
Enable Timeseries
Whether to return the results as a time series.
Generated NRQL
The NRQL query generated from your selections.
Click Validate & Run Query to run the query.
The Estimated Volume value shows the units per month. Click Preview Results to see the result.
NRQL
Use the NRQL tab to write your own NRQL query instead of using guided mode.
Numerator and denominator
The Dynamic Unit Cost Calculation panel shows the live result as you build the metric. It divides the numerator by the denominator to produce the Resulting Metric. For example, dividing your total cost by your total number of queries gives the cost per query.
When the result looks correct, click Confirm to save the unit cost, or click Discard changes to discard it.
View results
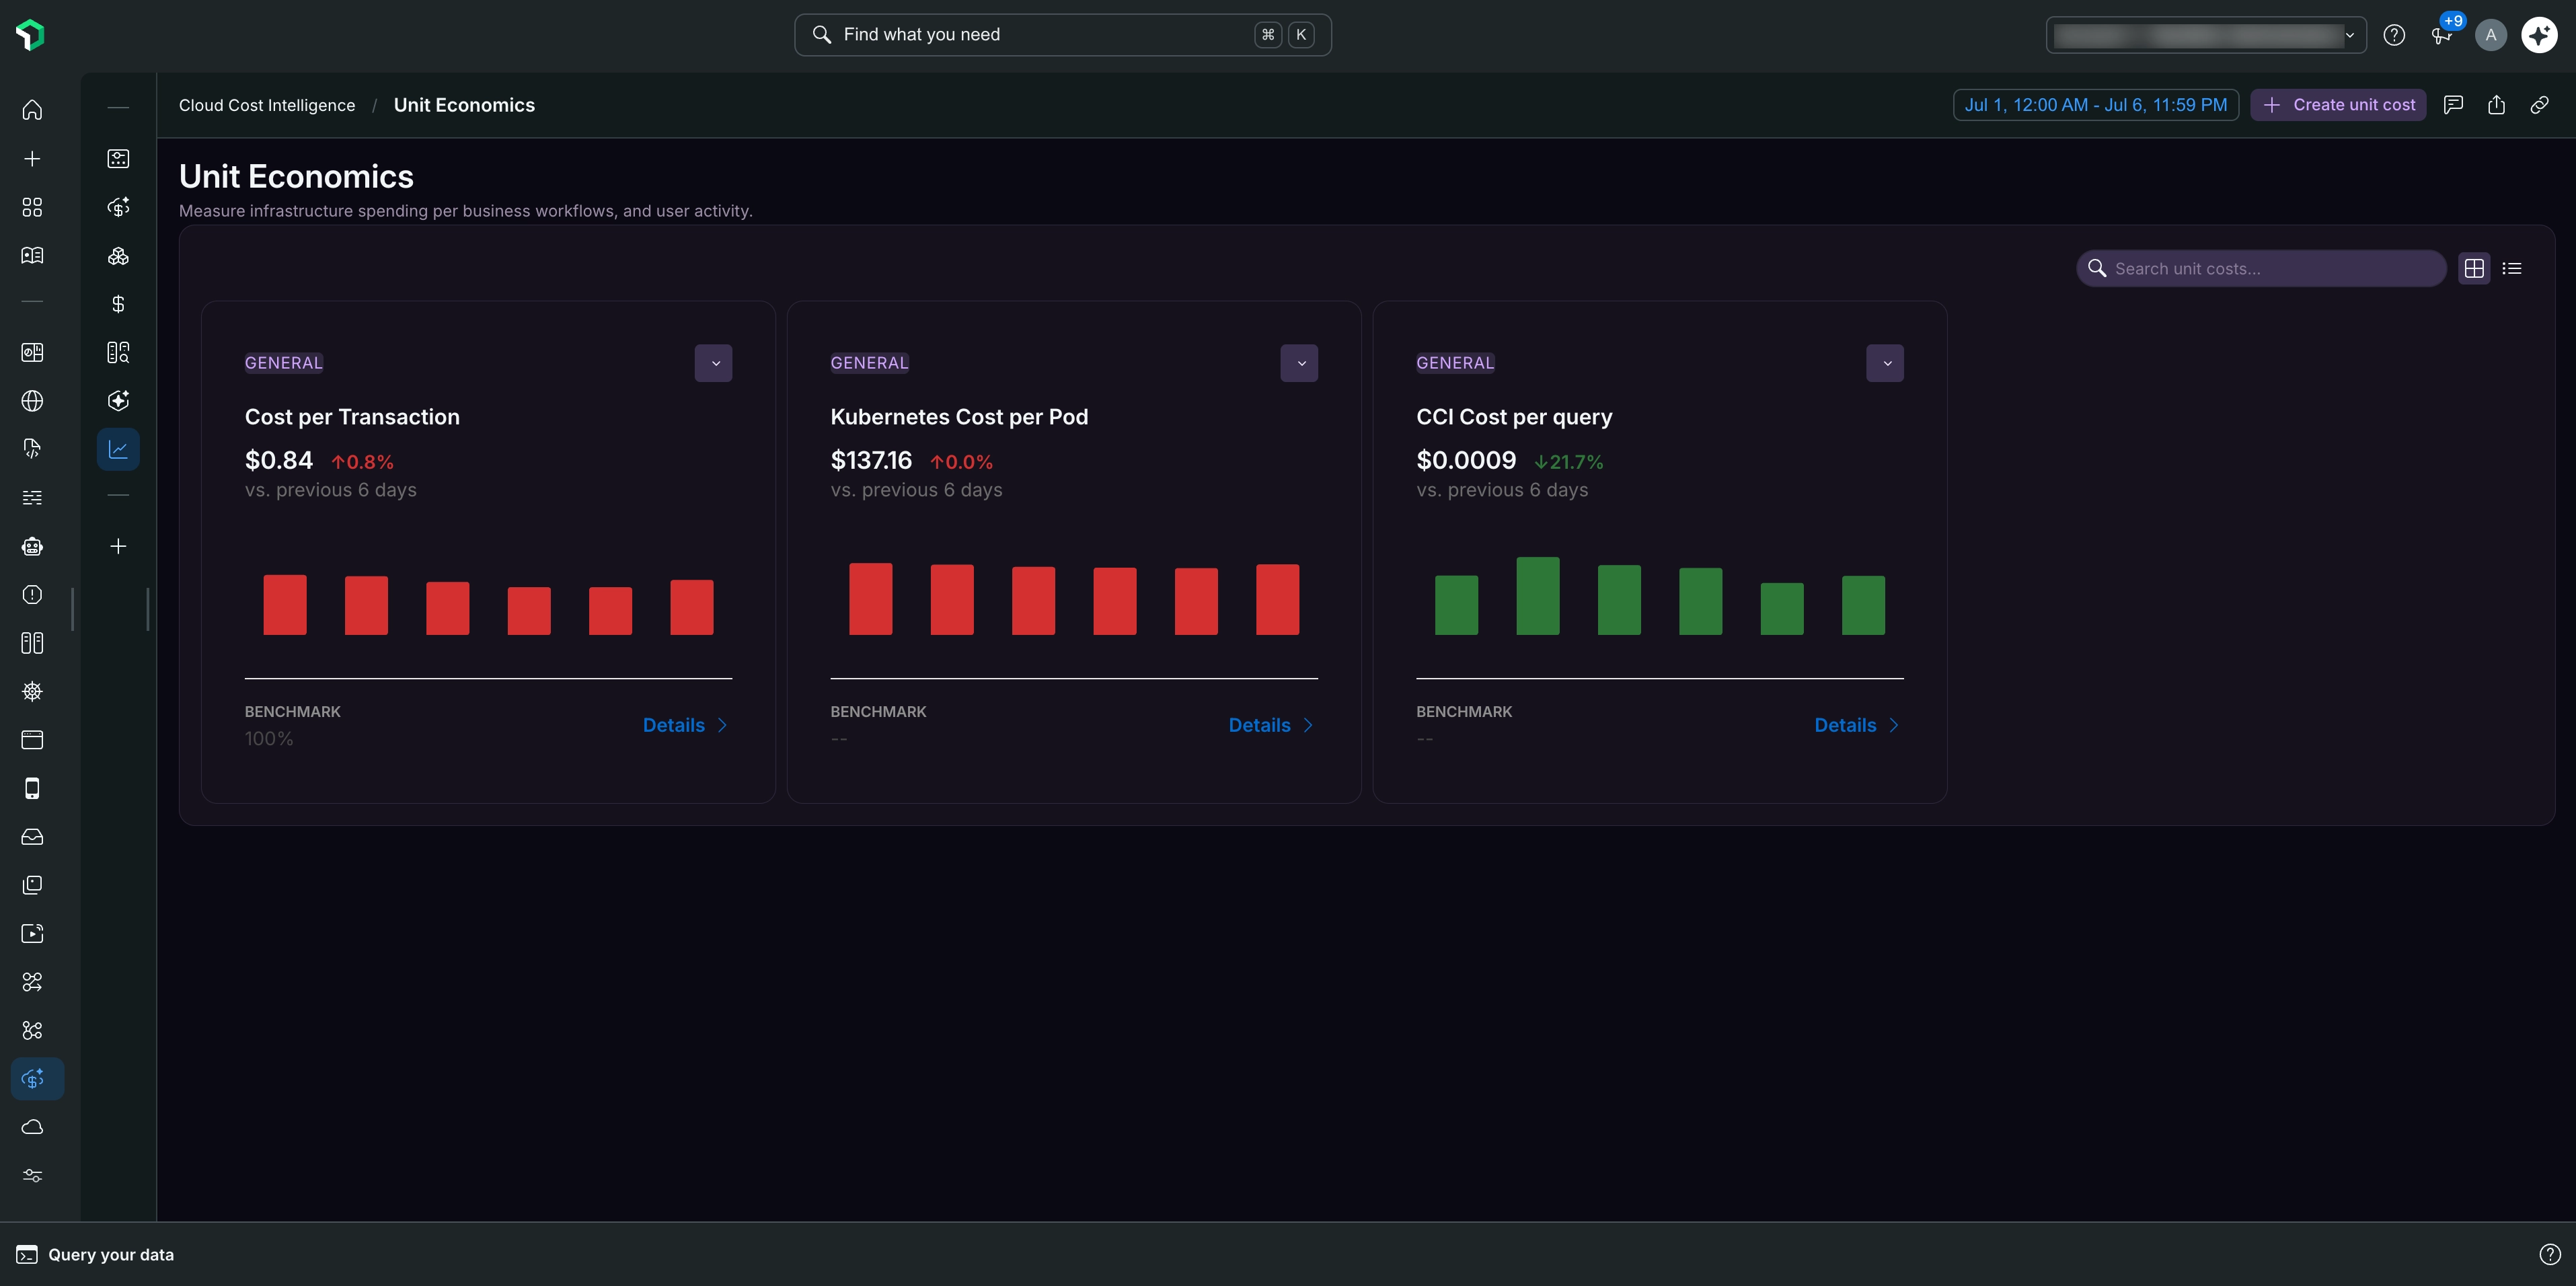
After you create a unit cost, the grid view displays all the unit metrics you've created, for example, Cost per Transaction, Kubernetes Cost per Pod, and CCI Cost per query.
Click Details > on a unit metric to open its detail view, which includes:
- Summary metrics: Unit Cost, Total Spend (the numerator), the denominator volume (for example, Transaction Volume), and Efficiency Score. Each metric shows the percentage change compared to the previous period. The efficiency score shows a value only when benchmark data is available.
- Unit Cost Trend: A chart that plots total spend and unit cost over the selected time range.
- Cost Contribution to Unit Cost: A chart that shows the percentage of total cost per day. Use the Group by dropdown to break the contribution down by a dimension such as account.
- Definition: The Cost Definition and Usage Definition queries that define the metric.
- Metadata: Details such as who created the metric, when it was created and last modified, its status, and its unit.
You can group results, for example, by cloud provider, to see how your unit cost breaks down across dimensions.