New Relic offers single-page application (SPA) monitoring to give you deeper visibility and actionable insights into real user interactions with single-page apps.
The SPA feature monitors soft navigations automatically, and our SPA API allows you to modify the interactions. Developers and their teams can use the API to:
- Track user journeys through URL paths on their SPA.
- Monitor the throughput and performance that real users are experiencing.
- Troubleshoot and resolve problems within the context of the page load.
- Query your data to assist with business decisions.
- Bring better apps to the marketplace more quickly.
Enable SPA monitoring
SPA monitoring is enabled by default for new browser agent installations. The SPA-enabled version of the agent gives access to other powerful New Relic features, like distributed tracing. For more information, see Enable browser monitoring.
Compatibility
For compatibility information about SPA-related features, see SPA requirements.
Analyze throughput and performance data
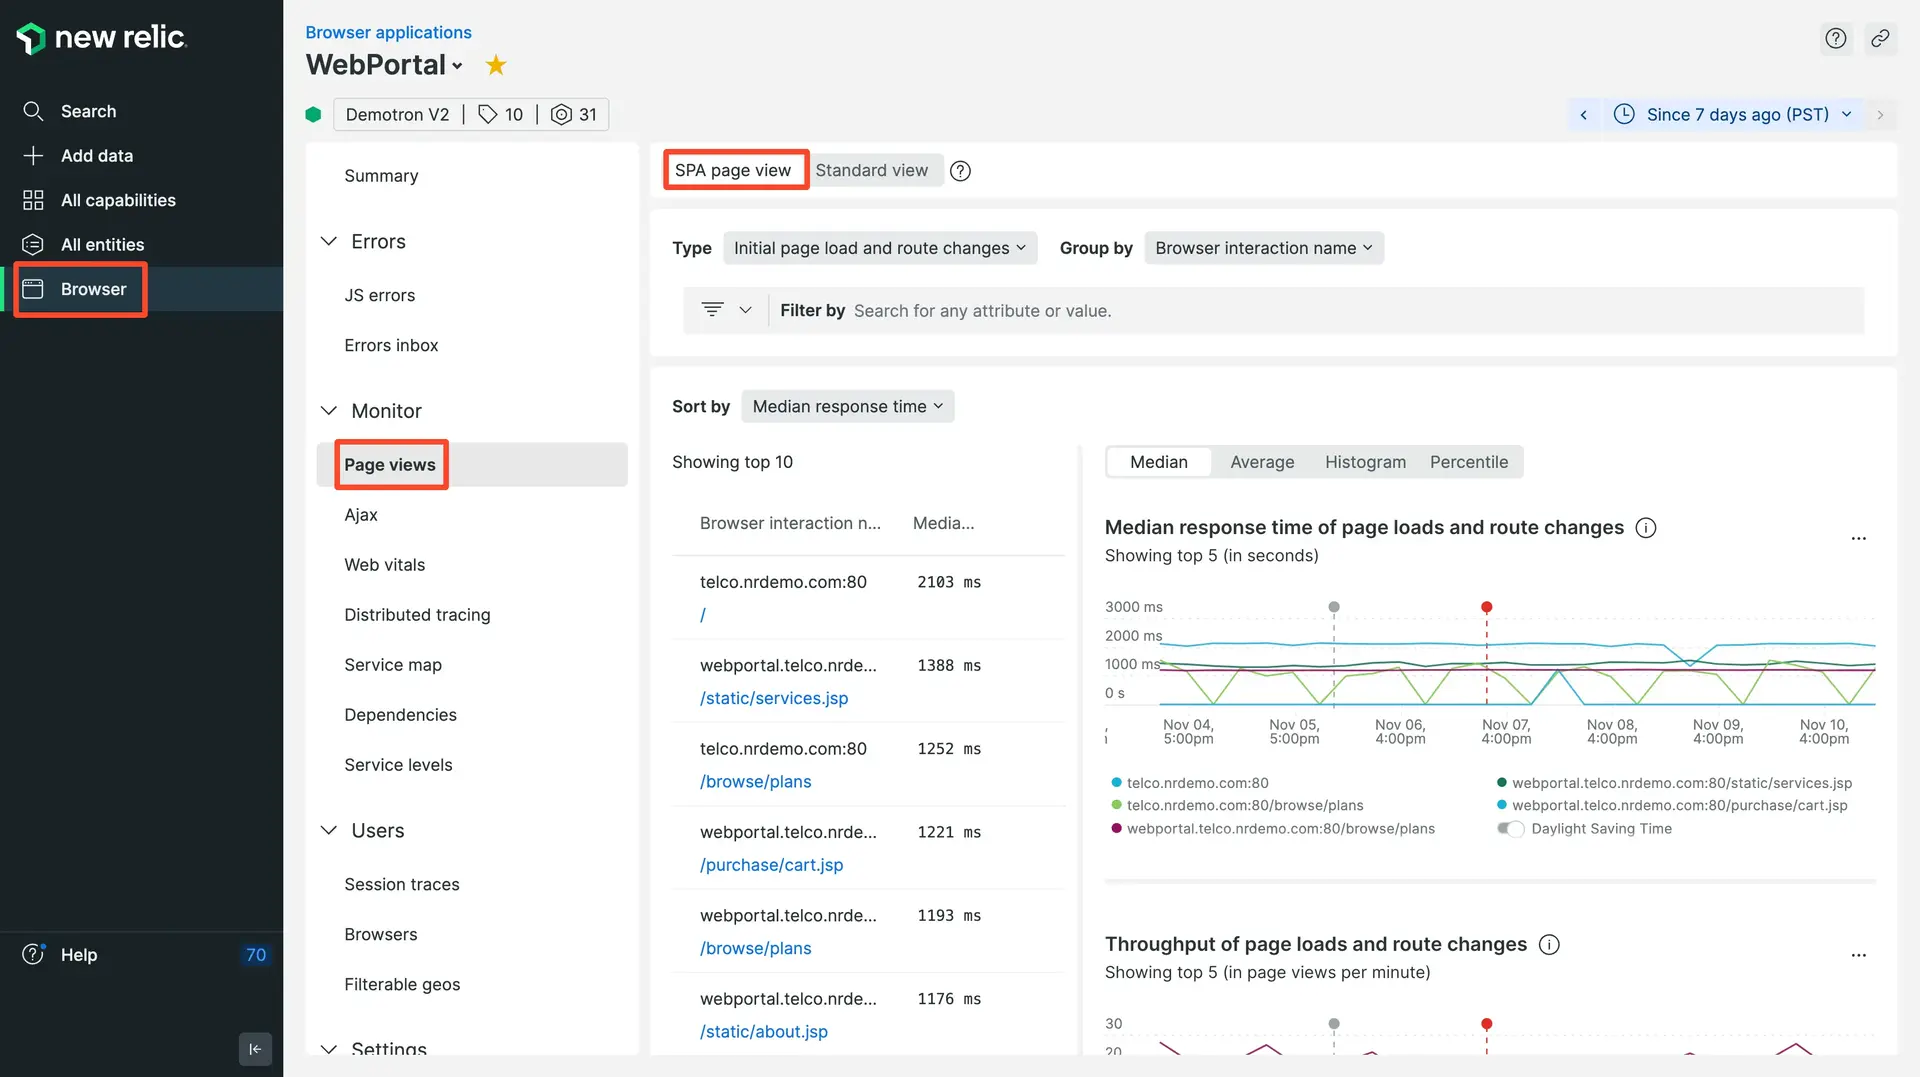
BrowserInteraction events drives the UI page views tab whenever SPA is enabled. Both the initial page load (hard nav) and route changes (soft navs) are shown.

one.newrelic.com > All capabilities > Browser > (select an app) > Page views: Use browser monitoring's SPA monitoring to examine the throughput and performance of your SPA-architecture app.
SPA data monitored by browser monitoring includes:
- Performance data and throughput for page loads and route changes
- AJAX request data
- Dynamic page updates, monitored using the SPA API
With this data, you will gain a clear understanding of how your users experience your app's page loads and route changes, and be able to solve bottlenecks and troubleshoot errors. For more about how New Relic handles SPA data, see Understand SPA data collection.
Browser SPA features
Here is a summary of SPA monitoring features:
Single-page app monitoring | Take advantage of these features |
|---|---|
Robust views in browser's UI | When a user initiates an interaction event, New Relic tracks the time until the url path changes and the next frame is repainted. When SPA monitoring is enabled, the Page views page in browser shows event-driven data about application usage levels (throughput) and user experience (performance), including:
|
Data analysis with metrics and events | Metrics and events supports two SPA-specific event types: Previously, |
Customized data from API | Use SPA API to obtain the specific data you need, such as custom naming, custom timing, or other custom attributes. |