Synthetic monitoring regularly checks your websites, critical business transactions, and API endpoints to measure optimal performance. Our tracks the actual results of webpage performance across all variations of devices, browsers, and connection speeds. Used together, they provide a direct page load time comparison between real user (browser) interactions and the synthetic monitors.
Compare performance and trends
New Relic's comparative charting feature helps operations managers and teams by providing:
- Benchmarks for page load times
- Additional insights to help you plan where to optimize your site
- Comparisons of synthetic trends vs. actual browser performance without needing to switch between our monitoring capabilities.
For example, during a page outage, you can compare synthetic monitoring trends to actual browser monitoring comparisons to see if an issue is also visible in synthetics UI, or if it is caused by variables outside of New Relic. This helps you more efficiently know where to take action.
What you need
The comparative charting feature requires:
- Browser monitoring enabled with the browser SPA agent (version 885 or higher).
- A synthetic browser or scripted monitor with one or more tests on the same URLs monitored by the browser agent.
View comparison data

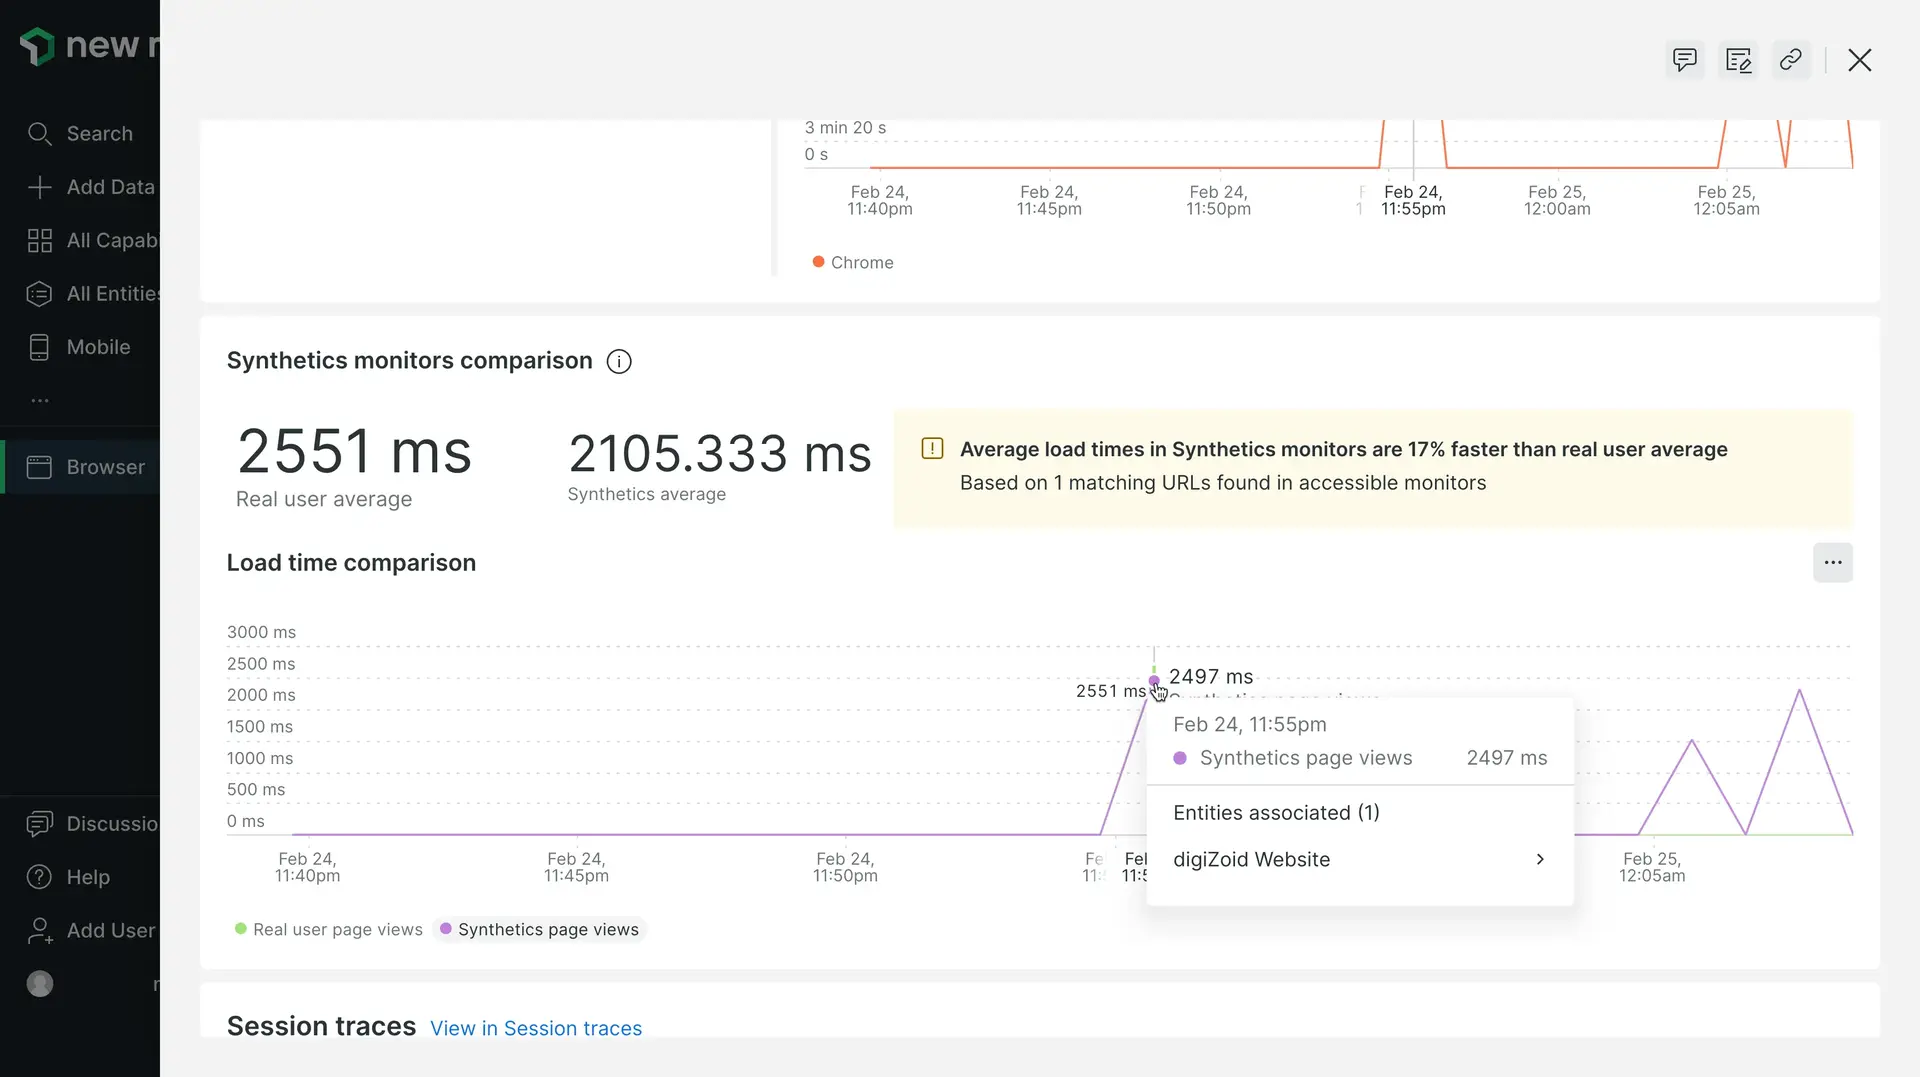
Go to one.newrelic.com > All capabilities > Browser > (select a browser app) > Page views > (click a a page monitored by synthetic monitoring) > (scroll down to the Synthetic monitors comparison chart).
The comparative charting feature appears whenever synthetic monitoring identifies a URL match with browser monitoring and can compare it.
Based on the comparison data sources, the Synthetic monitors comparison chart shows:
- Overall speed percentage comparison between browser (real user) page views and any matching URLs found in synthetic monitors that the user has permissions to view
- Number of URLs found in synthetic monitors that match the browser rollup URL
Don't see data in the Synthetic monitors comparison chart?
If you don't see data, please note that in some cases the simple browser monitor ends before the browser agent has had a chance to collect the BrowserInteraction event. In this case, no comparative charting data is displayed in the UI. In order to resolve this issue, create a scripted browser monitor instead, and add a call to wait (sleep) after the page is loaded. Here is an example:
$browser.get('https://www.mywebsite.com').then(function() { return $browser.sleep(1000);});Data sources
New Relic uses these data sources for the synthetics and browser comparison in the UI. For deeper analysis of the comparative chart data you see in the UI, use the query builder to run NRQL queries.
Variable | Description |
|---|---|
Monitor account ID | The account from which you are running the monitor: |
Monitor ID | The unique ID assigned to your synthetic monitor: |
Monitor job ID | The ID of a single synthetics monitor run, which began at a specific time and originated from a specific location: |
Real user average | The average page load time for real users viewing your website (excludes synthetic monitors). |
Real user page views | Page view details coming from visitors to your website (exclude synthetic monitors). |
Synthetic's average | The average page load time from the synthetic simple or scripted monitors that ran on your website. |
Synthetic's page views | Only traffic generated by synthetic simple or scripted monitors. |