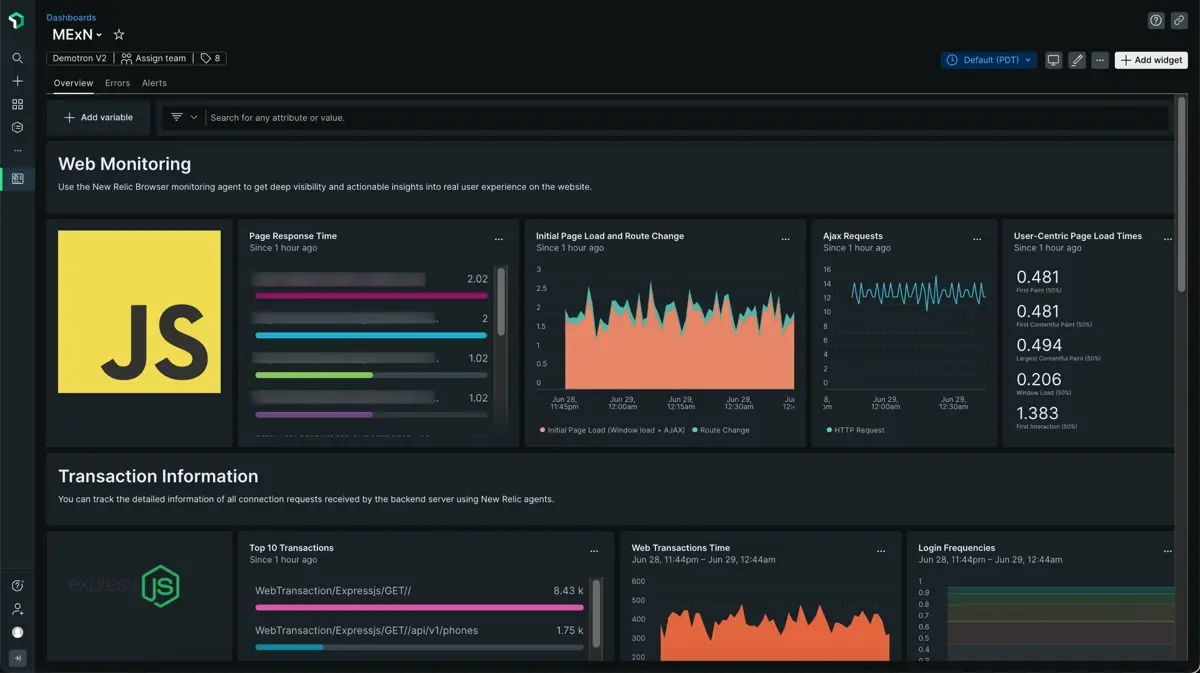
MEAN, MERN, and MEVN stacks are open-source full stack software development kits. Each kit uses a single codebase to develop web applications. New Relic has consolidated all three stacks into a single quickstart. Our MExN integration makes use of the agent, Node.js agent, and MongoDB integration to provide you with a pre-built dashboard with your most important metrics (like response time, CPU utilization, traffic, and login frequencies).

After setting up our MExN integration, we give you a dashboard for your MExN web app metrics.
Install
Optional: Install the infrastructure agent
Installing the infrastructure agent is optional, but doing this will get you important metrics about the host where your app is running.
To do this, follow the infrastructure agent install steps.
Install MongoDB quickstart
- Check out our MongoDB agent requirements in our documentation before installing the agent.
- Open the MongoDB quickstart installation.
- Click Install now to start the MongoDB agent installation.
Install Node.js agent
- Check out our Node.js agent requirements in our documentation.
- Open the Node.js quickstart installation.
- Click Install now to start the Node.js agent installation.
Install the browser agent
From one.newrelic.com, go to the + Integrations & Agents page.
Click Browser and mobile, then click Browser monitoring.
Select the Select copy/paste JavaScript code option (for more about this code, see our browser install docs).
Complete the rest of the steps and click Enable.
Go to the
index.htmlfile of your React application or Angular application or Vue application.Paste our browser code snippet script tag right before the body tag ends (
</body>).Restart your application.
In a couple of minutes, your application will send metrics to one.newrelic.com.
Find your data
To get your MExN dashboard:
- From one.newrelic.com, go to the +Integrations & Agents page.
- Click on Dashboards.
- In the search bar, type
MExN. - The MExN dashboard should appear. Click on it to install it.
Your MExN dashboard is considered a custom dashboard and can be found in the Dashboards UI. For docs on using and editing dashboards, see our dashboard docs.
For information about data reported, see the docs for each of the tools you installed:
Here's a NRQL query checking the average window load time for the various browsers used by users on desktop computers:
SELECT average(windowLoad) FROM PageViewTiming WHERE (deviceType = 'Desktop') FACET `userAgentName` SINCE 604800 seconds AGO TIMESERIESWhat's next?
To learn more about querying your data and creating custom dashboards, check out these docs: