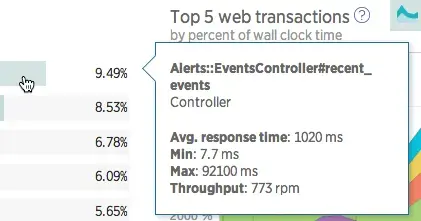
APM's Transactions page helps you identify transactions that may be good candidates for fine-tuning performance problems or resolving errors. This page lists the selected app's transaction Requests, the top twenty transactions by percent of wall-clock time, and relevant throughputs (requests per minute or rpm).
For non-web transactions (such as message processing, background tasks, and other processes and jobs that do not handle web requests), this page shows charts of CPU and memory usage.
Types of transactions
Tip
To get a high-level overview of all your applications and services, use our entity explorer.
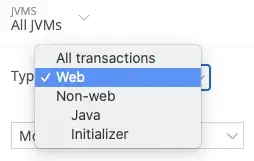
Depending on your selected application, the Transactions page may include a dropdown you can use to select from the types of transactions available. New Relic measures processing time by type of request (web transaction or non-web transaction). This may include:
- Web: App server requests
- Non-web: Other requests (operations, background tasks, etc.)
The Transactions page also may include links to transaction traces and key transactions. The types of information available will depend on your selected app and the type of request (web or non-web).
Wall-clock time
Wall-clock time measures "real-time elapsed" during a specific transaction. For example, let's say you're an engineer responsible for managing the checkout experience on an ecommerce site. You'd like to understand how long it takes for a customer to add an item to their cart. The transaction took 15 seconds to complete but one minute in the real world or on the "wall clock" for the customer. This discrepancy in time could be because the function had to wait for network calls or other inputs and outputs, and that waiting time isn't considered in the system's transaction time. New Relic uses wall-clock time for all the transactions and then sums that value across all of the transactions.
In the above example, imagine that when a customer adds an item to their cart, the host has to make two requests to complete this work. One of these functions might take 3 seconds to complete, and the other takes 2 seconds, but because they occur simultaneously, the customer only had to wait 3 seconds. Because of this parallel work, you may see percentages over 100. For example, 100% would indicate that the execution time across all selected transactions equals the time expended when recording wall-clock time.
View transactions
To view information about your app's transaction requests:
- Do one of the following:
- Go to one.newrelic.com > All capabilities > APM & services > (select an app) > Monitor > Transactions.
- Go to one.newrelic.com > All capabilities > APM & Services > (select an app) > Monitor > Transactions.
- If applicable: To change which available types of transactions appear, select the Type.
- Select the sort order, or keep the default.
- Select the type of view as a chart (default), histogram, or percentile, if available.
- To view additional details, use any of the transaction drill-down functions.
- To add a chart to a dashboard, mouse over the chart, then select the Add to a dashboard link that appears below it.
If a chart's background is light red, this indicates a time period when an alert condition's Critical threshold has been breached. To view the alert event details in alerts, click the chart.
For more information, see the documentation about managing your dashboard.
Use drill-down functions
Use any of New Relic's standard user interface functions to drill down into detailed information. The Transactions page has additional drill-down functions.
Additional functions
Here are some additional functions for the Transactions page's selected transaction.
If you want to... | Do this... |
|---|---|
View transactions for operations and other background tasks | Change the Type to Other transactions (or a specific type listed), then select a specific transaction. The Transactions page shows the top five transactions for this selection by wall-clock time, CPU usage, and memory usage. |
Track a transaction that is important to your business | Select the transaction's name, then select Track as key transaction. |
View transaction trace details | A transaction trace is a complete picture of a single transaction.
|
Examine logs for trace details | If you are using our logs in context feature, you can see any logs that are linked to your traces.
|
Add or view transaction segments |
|
View reports | You can also use the Web transactions analysis report for web transactions and the Background jobs analysis report for non-web transactions to compare the amount of time spent in throughput, total time in the transaction, average time to execute it, and Apdex score as applicable. |
Delete all transaction traces | CautionIf you select Delete all traces, you cannot recover them. |


