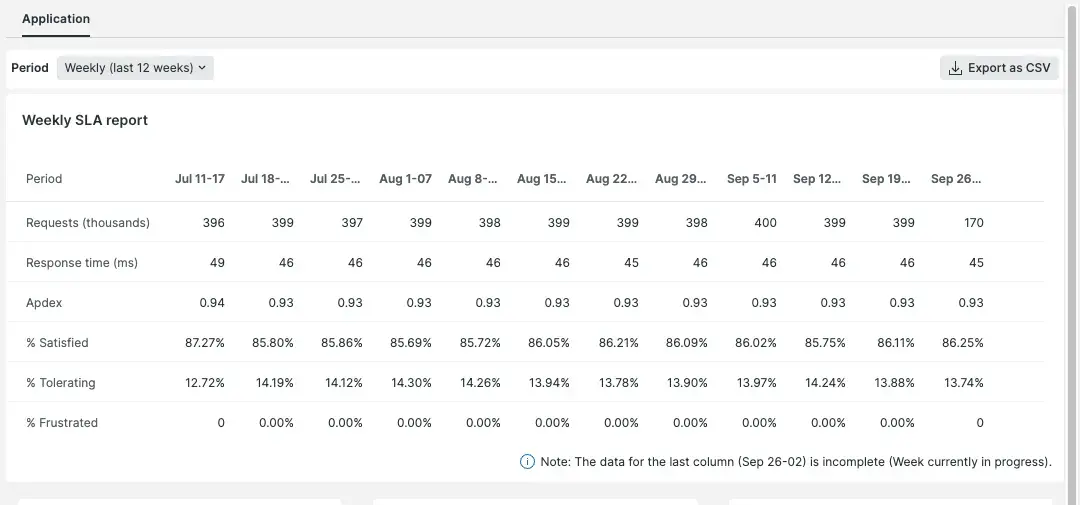
APM provides service level agreement (SLA) reports. SLA reports help you better understand your application performance by showing application downtime and trends over time.
SLA reports can be viewed in APM or downloaded as comma-separated value (.csv) files. Depending on your account level's data retention policy, you can view daily, weekly, or monthly reports.
Important
In addition to the APM SLA reports described here, we've got an advanced service level management feature, which lets you define the most important performance metrics for your business and view results across workloads.
View SLA reports
To view the SLA reports for your app: Go to one.newrelic.com > All capabilities > APM & services > (select an app) > Reports > SLA. The report defaults to the Application tab. SLA report data shows the account owner's time zone, with periods beginning and ending at midnight in that time zone.

If you have not enabled browser for your app, the SLA report shows links to requests, response time, and Apdex only for your application server. To learn how to define your SLA report metrics, read our app performance reports doc.
If you want to... | Do this |
|---|---|
Show or hide details | Select the End user tier (if available) or Application server heading. |
View another time period | Select the tab for daily, weekly, or monthly SLA reports if available. |
Save or export the report | Select Export as CSV to create a report file with comma-separated values. |
View metric trends
To drill down into detailed information, select the link. This includes:
- End users (from browser): Page views, load time, and Apdex
- Application server (from APM agents, such as Java or Ruby): Requests, response time, and Apdex
The metric detail window below the report list shows trends over the selected period (12 days, weeks, or months). Use any of New Relic's available standard page functions to drill down into detailed information. In addition:
- To view other details, select its link.
- To clear the details and return to the main SLA report, select the tab.
Analyze your data
APM includes several reports in the user interface. To gather, analyze, and visualize data about your software in other formats, use query builder.