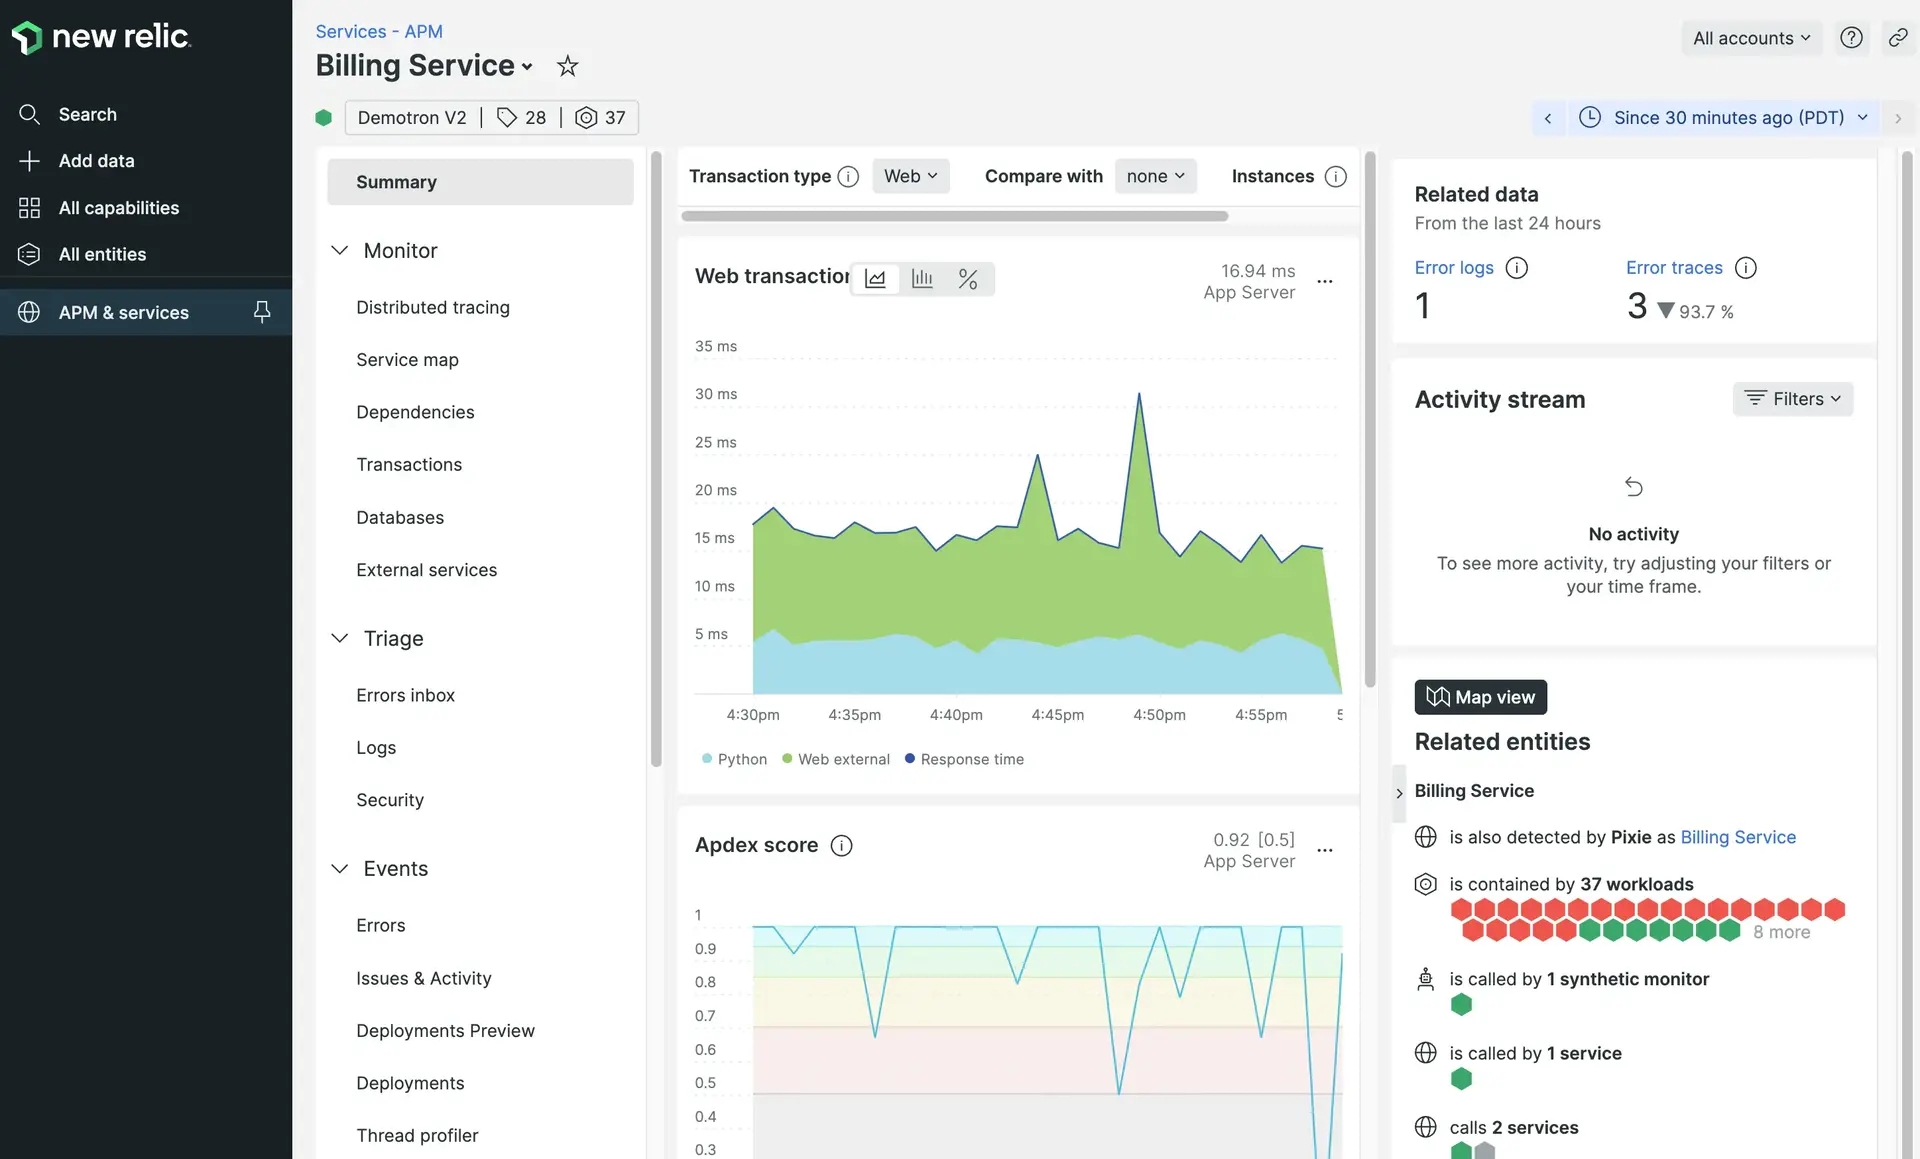
With our .NET agent for application performance monitoring, you can:
- Use APM to get a high-level overview of your app, to see code-level details like transaction traces, database queries, and errors, and to track activity across a large distributed system.
- Get proactive notifications from alerts to ensure your app is up and running smoothly.
- Use the query builder to query your data and create custom dashboards with that data.
- Install infrastructure monitoring to view the performance of your app's host environment.

After installing the .NET agent, you'll see a summary of your app's performance on our APM Summary page.
Install the agent
To use the .NET agent:
- Make sure your system meets the .NET agent compatibility
- Sign up for a New Relic account.
- Install the .NET agent via the in-product launcher below or by following our standard install procedures in the docs.
Support for both .NET Framework and .NET Core
New Relic's .NET agent supports both .NET Framework and .NET Core, and it works with all .NET compatible languages, such as VB.NET, C#, and CLI.
The agent's support for .NET Core takes advantage of the compatibility, speed, expanded API features, and cross-platform capabilities of Microsoft's .NET Core. The agent does not support Microsoft .NET Core versions earlier than 2.0.
With New Relic's support for .NET, you can monitor your apps in dynamic or distributed environments, such as:
- Cloud-managed server VM images
- On-host VM servers
- Microsoft Azure App Services
- Self-hosted Windows and Linux systems
- AWS EC2 VMs
Extend your instrumentation
After installing the .NET agent, extend the agent's instrumentation with one or more of these methods:
Instrumentation options | Details |
|---|---|
Integrate the .NET agent with to gain visibility into end-user activity.
| |
Instrument transactions not captured as part of New Relic's automatic framework instrumentation. | |
See the .NET agent API guide to learn how to customize the agent's behavior. For example, you can collect custom metrics, flag an error, or ignore a particular transaction entirely. | |
Customize the attributes attached to transactions. Customizing attributes allows you to avoid sending sensitive attributes, or to collect additional attributes for deeper visibility into your transactions. | |
Enable distributed tracing to understand activity across a complex, distributed system that uses many services and microservices. | |
Explore these tools: OpenTelemetry exporter and .NET Telemetry SDK. |
View logs for your APM and infrastructure data
You can also bring your logs and application's data together to make troubleshooting easier and faster. With logs in context, you can see log messages related to your errors and traces directly in your app's UI. You can also see logs in context of your infrastructure data, such as Kubernetes clusters. No need to switch to another UI page.
Check the source code
The .NET agent is open source software. That means you can browse its source code and send improvements, or create your own fork and build it. For more information, see the README.