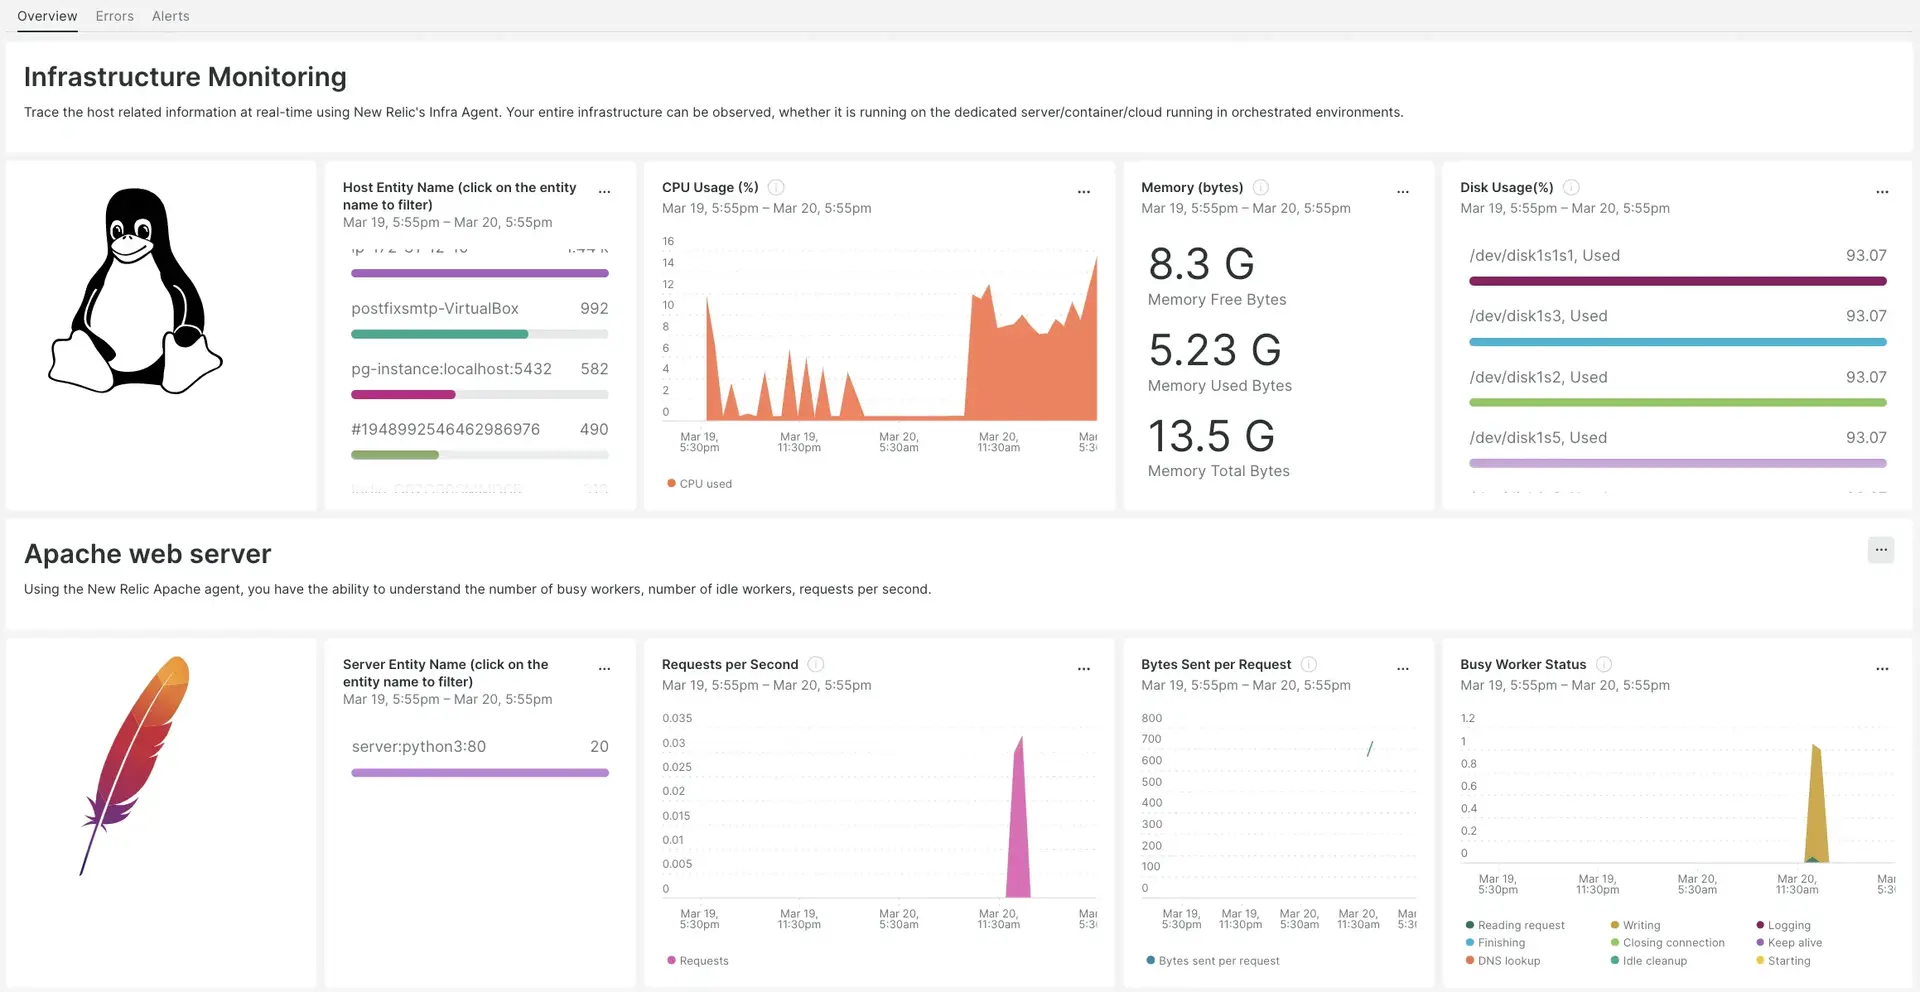
Our LAMPy integration makes use of the infrastructure agent, MySQL integration, Apache integration, and Python agent to provide you with a pre-built dashboard with your most important metrics like response time, CPU utilization, traffic, and login frequencies.

After setting up our LAMPy integration, we give you a dashboard for your LAMPy web app metrics.
Step 1: Install the infrastructure agent
To do this, follow the infrastructure agent install steps for the host containing your LAMPy application.
Step 2: Install the MySQL integration
Our LAMPy integration relies on the MySQL integration to work. To learn more and check requirements review our MySQL docs.
- From one.newrelic.com click Integrations & Agents > Infrastructure & OS > MySQL.
- Follow the instructions to install the MySQL agent.
Step 3: Install the Apache integration
Our LAMPy integration relies on the Apache integration to work. To learn more and check requirements review our Apache docs.
- From one.newrelic.com click Integrations & Agents > Infrastructure & OS > Apache.
- Follow the instructions on the screen to install Apache agent.
Step 4: Install the Python agent
Our LAMPy integration relies on the Python agent to work. To learn more and check requirements review our Python docs.
From one.newrelic.com click Integrations & Agents > Application monitoring > Python.
Name your application.
Download the configuration file and place it in your application's root directory.
Integrate your python agent that is connected to Django web site. This python agent also runs on the Apache server.
Add this line to your
settings.pyfile:NEW_RELIC_CONFIG_FILE = BASE_DIR / 'newrelic.ini'Add these lines to your
wsgi.pyfile:import newrelic.agentfrom django.conf import settingsfrom django.core.wsgi import get_wsgi_applicationapplication = get_wsgi_application()newrelic.agent.initialize(settings.NEW_RELIC_CONFIG_FILE)newrelic.agent.WSGIApplicationWrapper(application)
Step 5: Restart your Apache server
Wait for a few minutes and then proceed to finding your data in New Relic.
Find your data
To get your LAMPy dashboard:
- From one.newrelic.com, go to the Integrations & Agents page.
- Click on Dashboards.
- In the search bar, type
LAMPy. - The LAMPy dashboard should appear. Click on it to install it.
Your LAMPy dashboard is considered a custom dashboard and can be found in the Dashboards UI. For docs on using and editing dashboards, see our dashboard docs.
For information about data reported, see the docs for each of the tools you installed:
If you installed the infrastructure agent, you'll also receive infrastructure data.
Here is an example NRQL query to check bytes sent per request:
SELECT (average(`apache.server.net.bytesPerSecond`) / average(`apache.server.net.requestsPerSecond`)) as 'Bytes sent per request' FROM Metric TIMESERIES autoWhat's next?
To learn more about querying your data and creating custom dashboards, check out these docs: