Nginx monitoring integration
Our NGINX integration collects and sends inventory, logs, and metrics from your NGINX server to our platform, where you can see data on connections and client requests so that you can find the source of any problems.

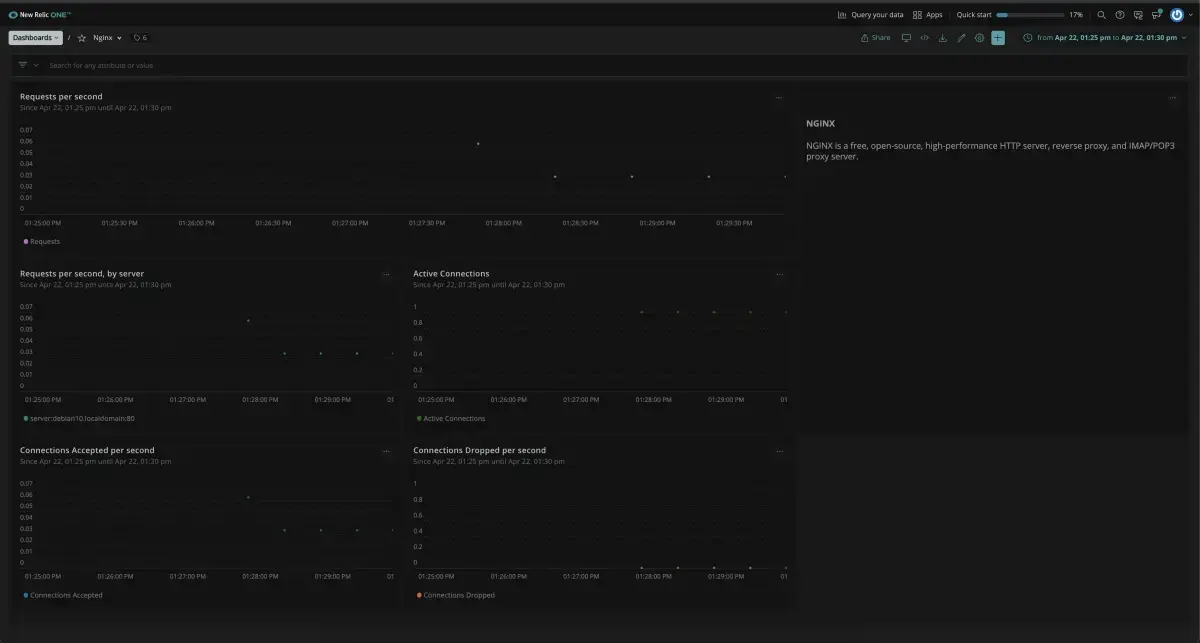
Dashboard installed through the New Relic NGINX Monitor quickstart.
To get the most out of this page, select the installation method that fits your environment. You need a New Relic account to finish the installation process.
NGINX config settings
The following configuration options are available:
Setting | Description | Default | Applies to |
|---|---|---|---|
| The URL set up to provide the metrics using the status module. |
| Metrics/Inventory |
| Name of NGINX status module.
|
| Metrics |
| Connection timeout to the NGINX instance in seconds. |
| Metrics |
| Set to |
| Metrics |
| The path to the NGINX configuration file. | N/A | Inventory |
| Enable multi-tenancy monitoring. Read more about remote monitoring. |
| Metrics/Inventory |
| Set to |
| |
| Set to |
|
Metric data
The NGINX integration collects the following metrics:
중요
- To monitor NGINX using OpenTelemetry, see Monitor NGINX with OpenTelemetry.