이 페이지에서는 Pathpoint의 업데이트된 버전을 다룹니다. 정식 버전에 대해서는 뉴렐릭 Pathpoint 소개를 참조하십시오.
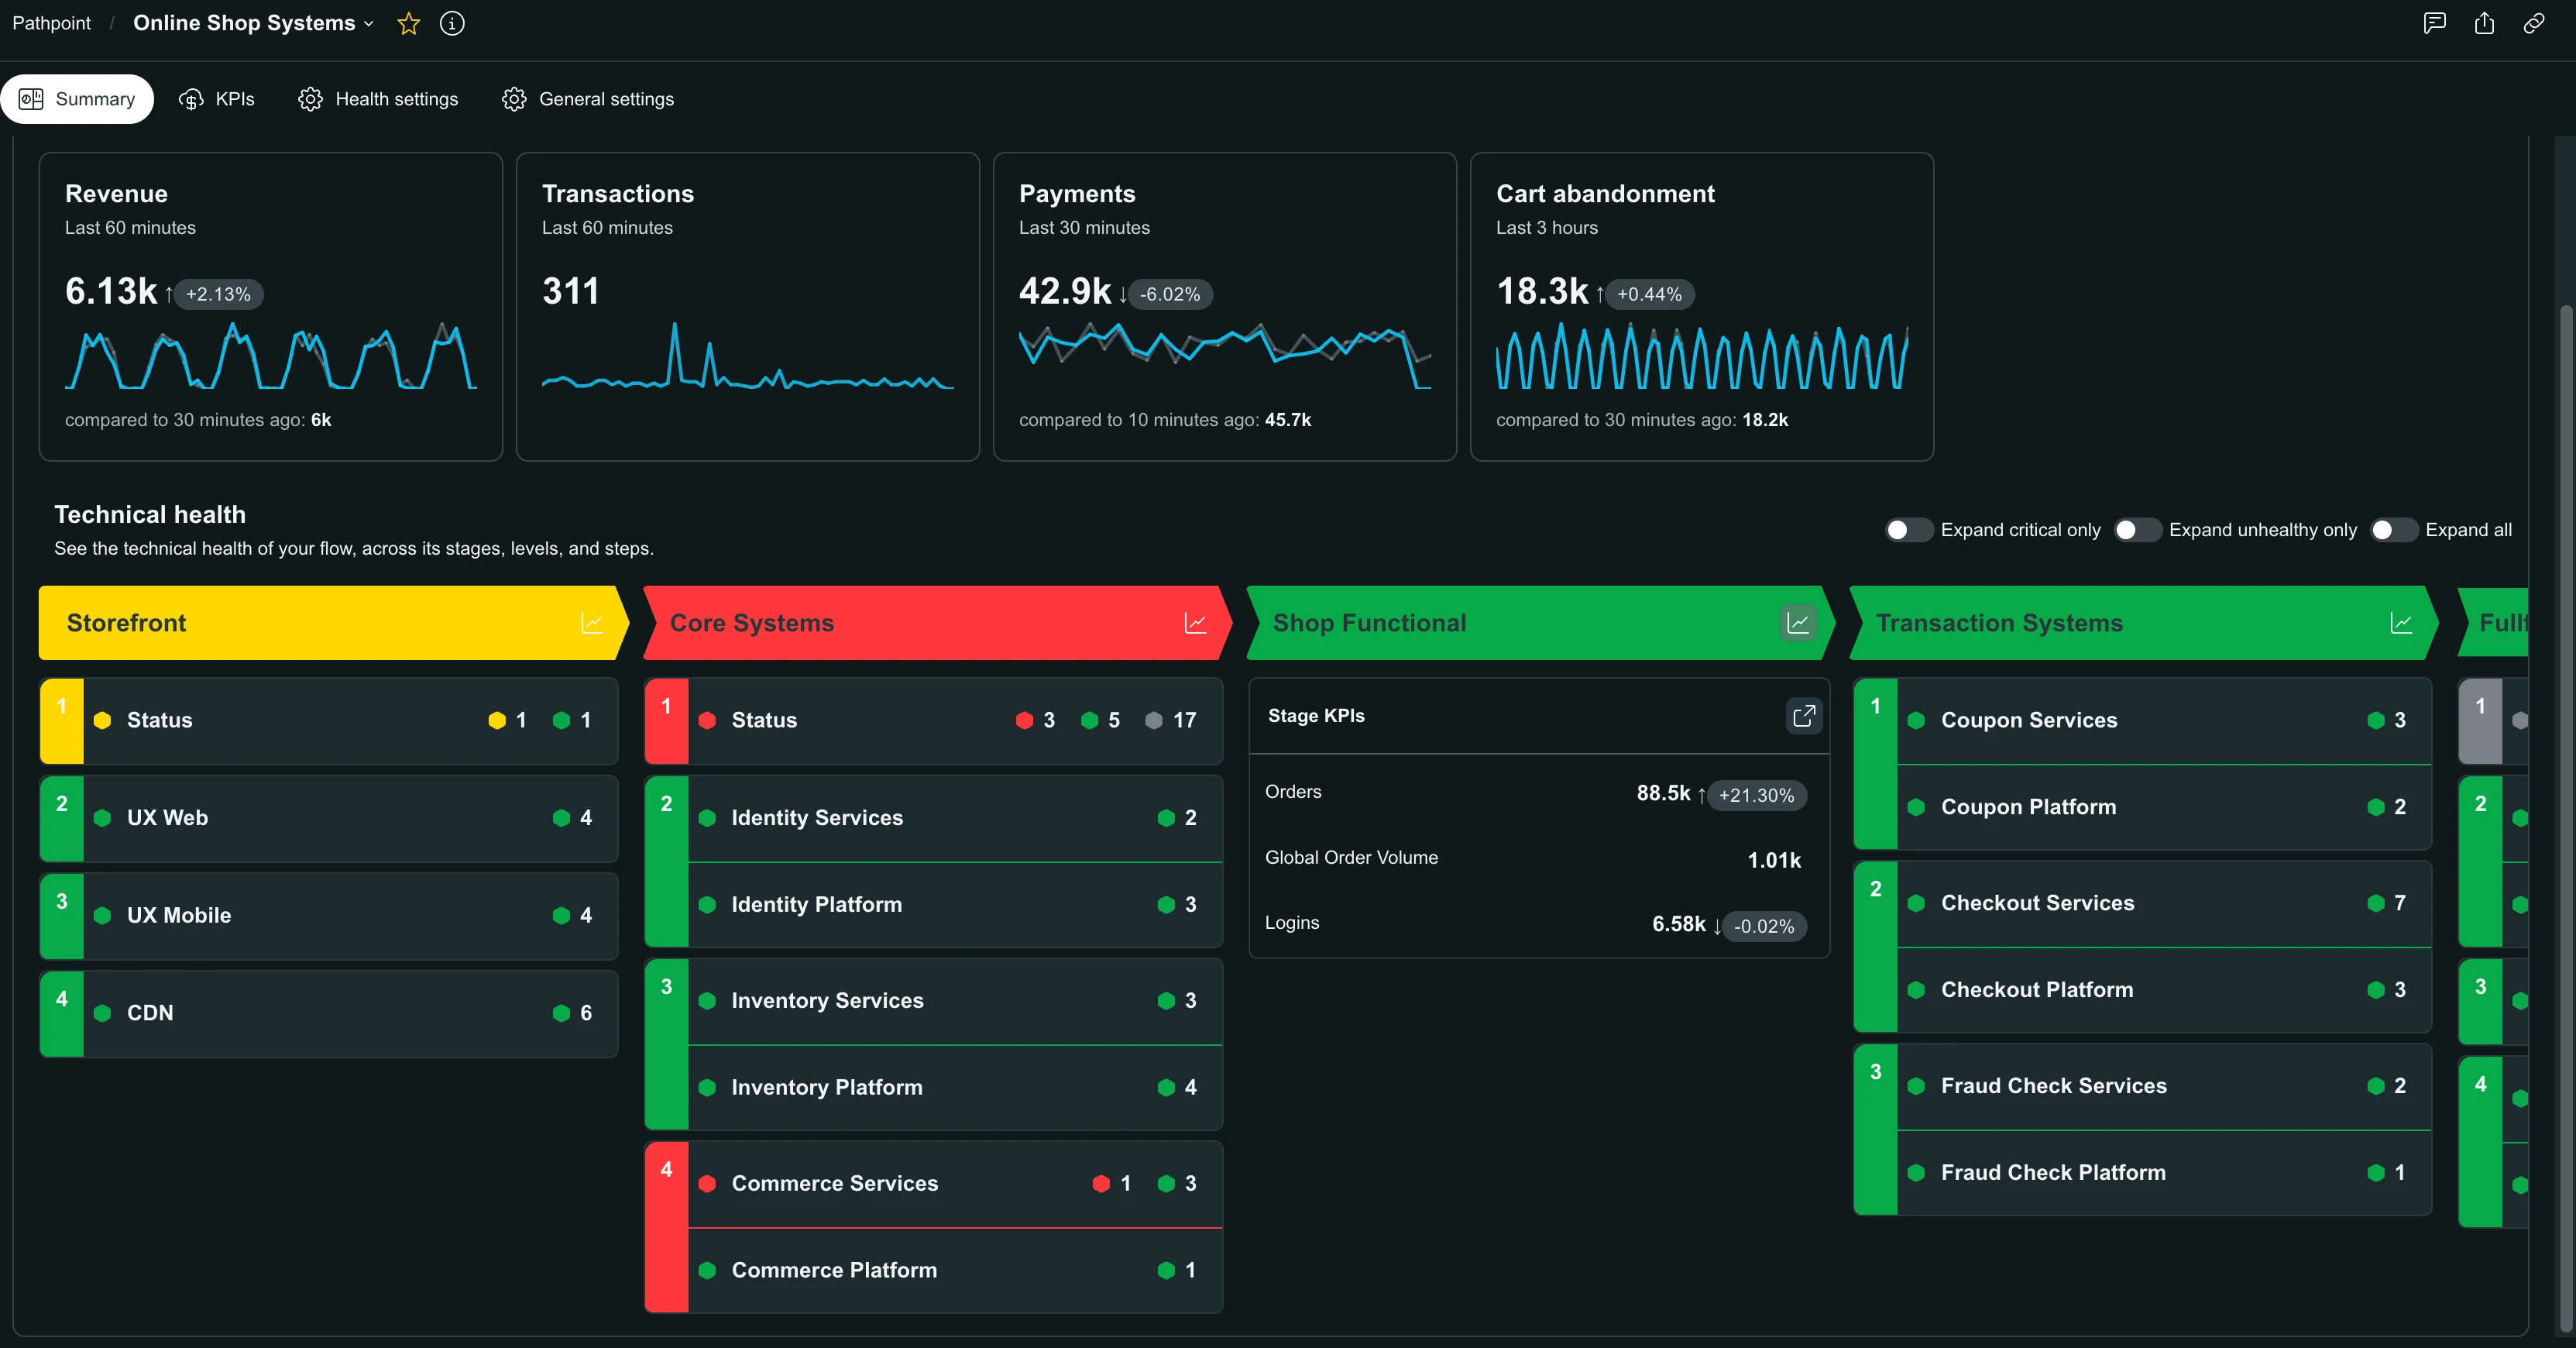
플로우 뷰는 플로우의 활성 상태를 보여주며, 여정에서 문제가 발생한 영역을 쉽게 식별할 수 있도록 설계되었습니다.
Flow 뷰를 열려면 Flows 페이지의 아무 행이나 클릭하십시오. 자세한 내용은 Flows 페이지를 참조하십시오.
메모
플로우 뷰는 신호의 실시간 상태를 반영하며, 플로우에 설정된 간격으로 새로 고쳐집니다.
각 Pathpoint 흐름은 다음과 같이 구분됩니다.
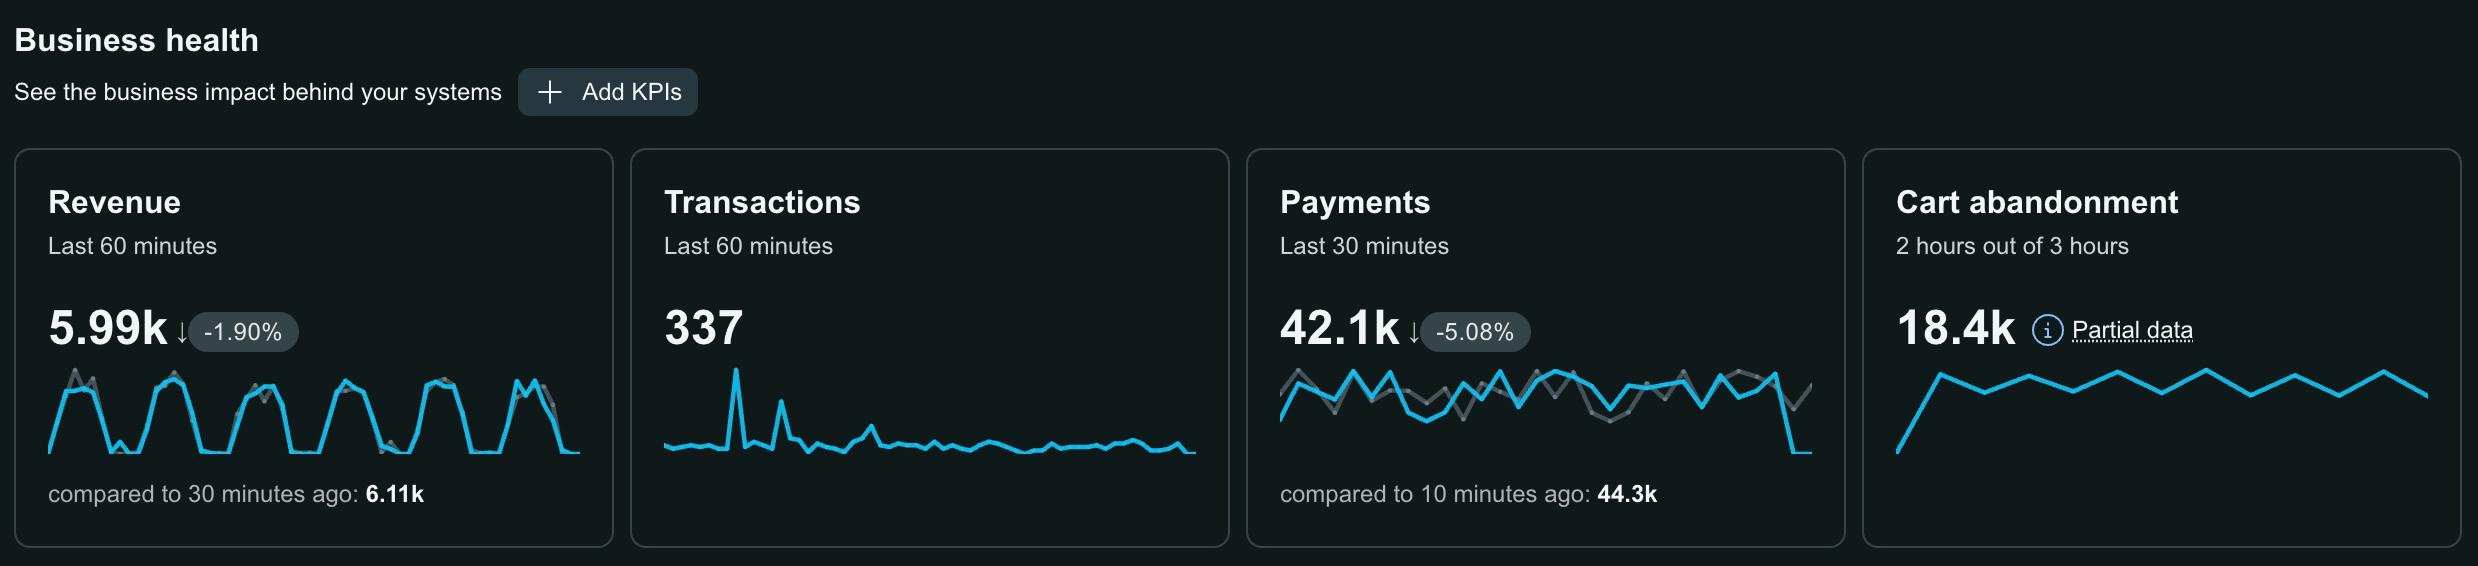
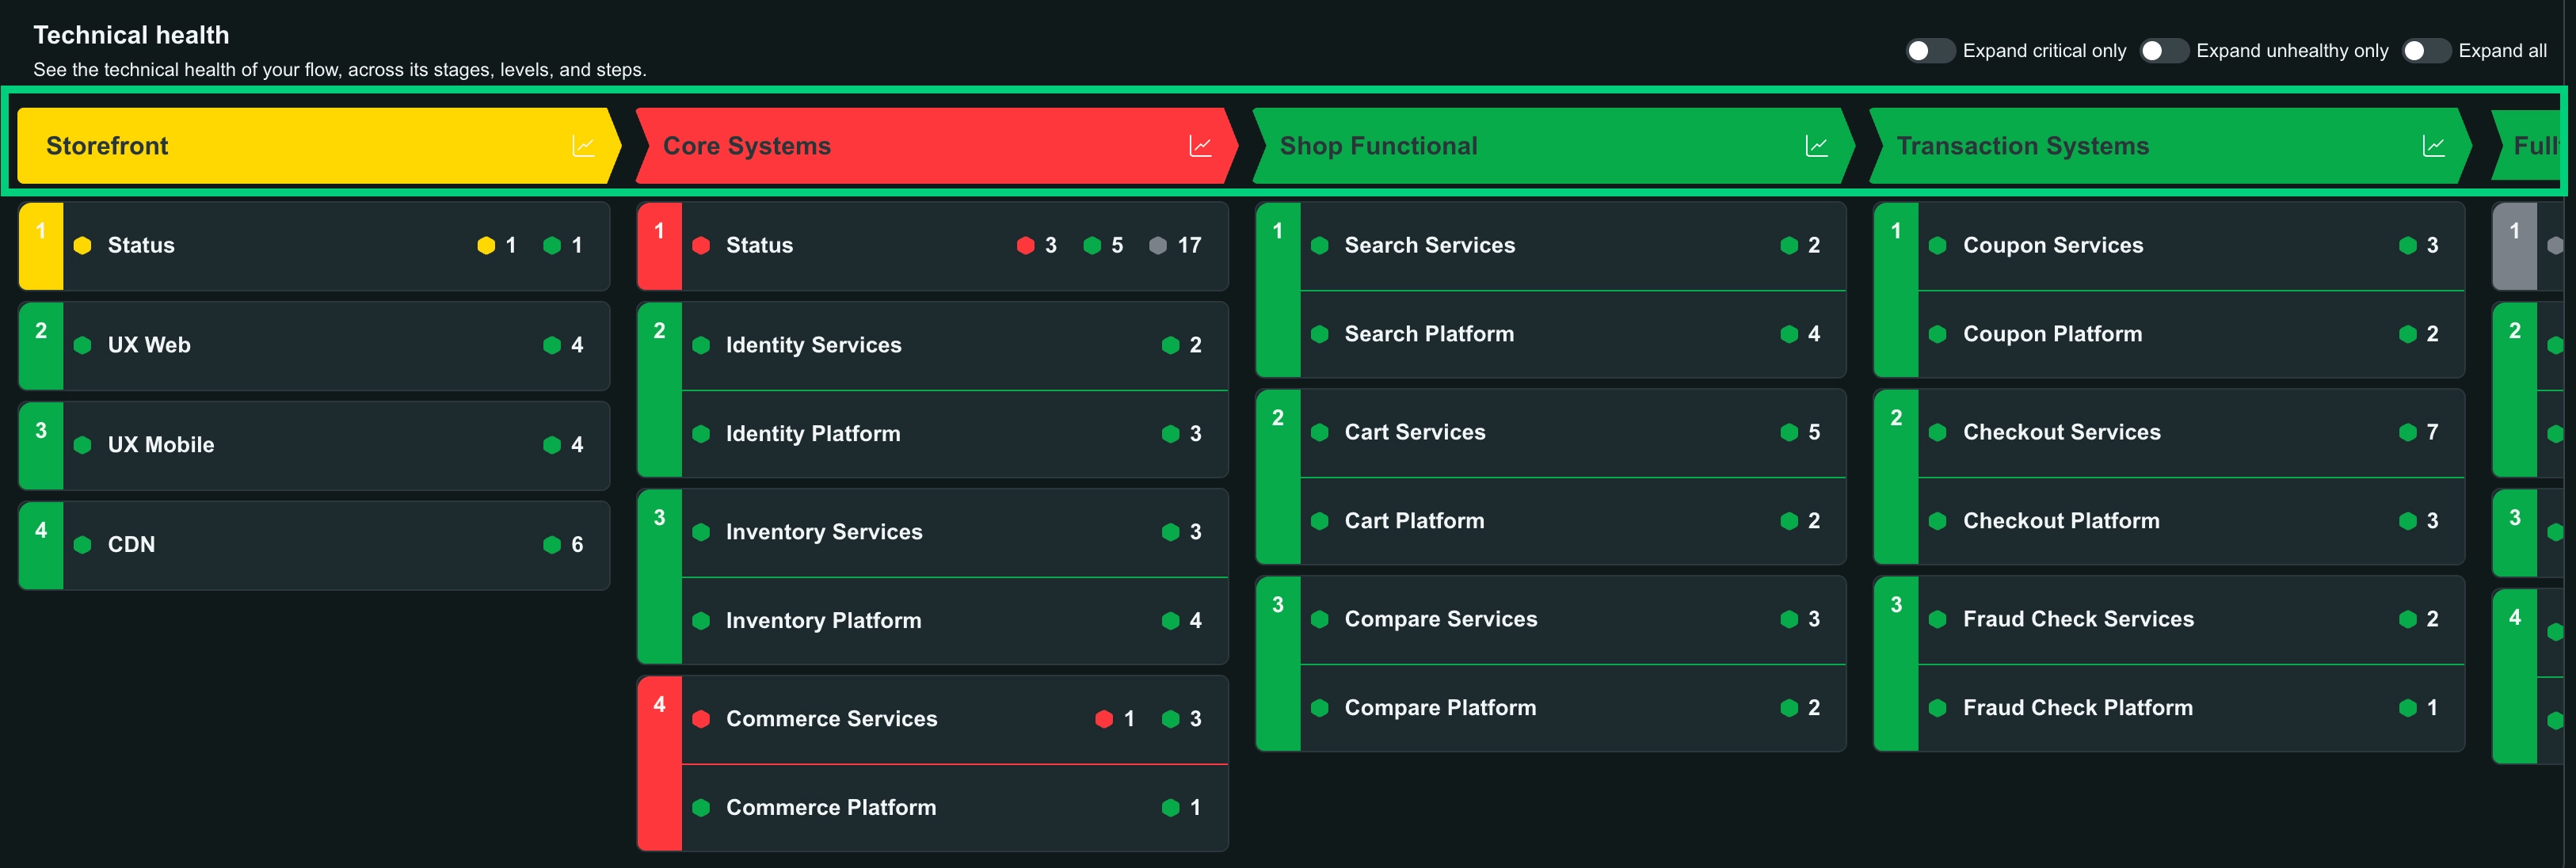
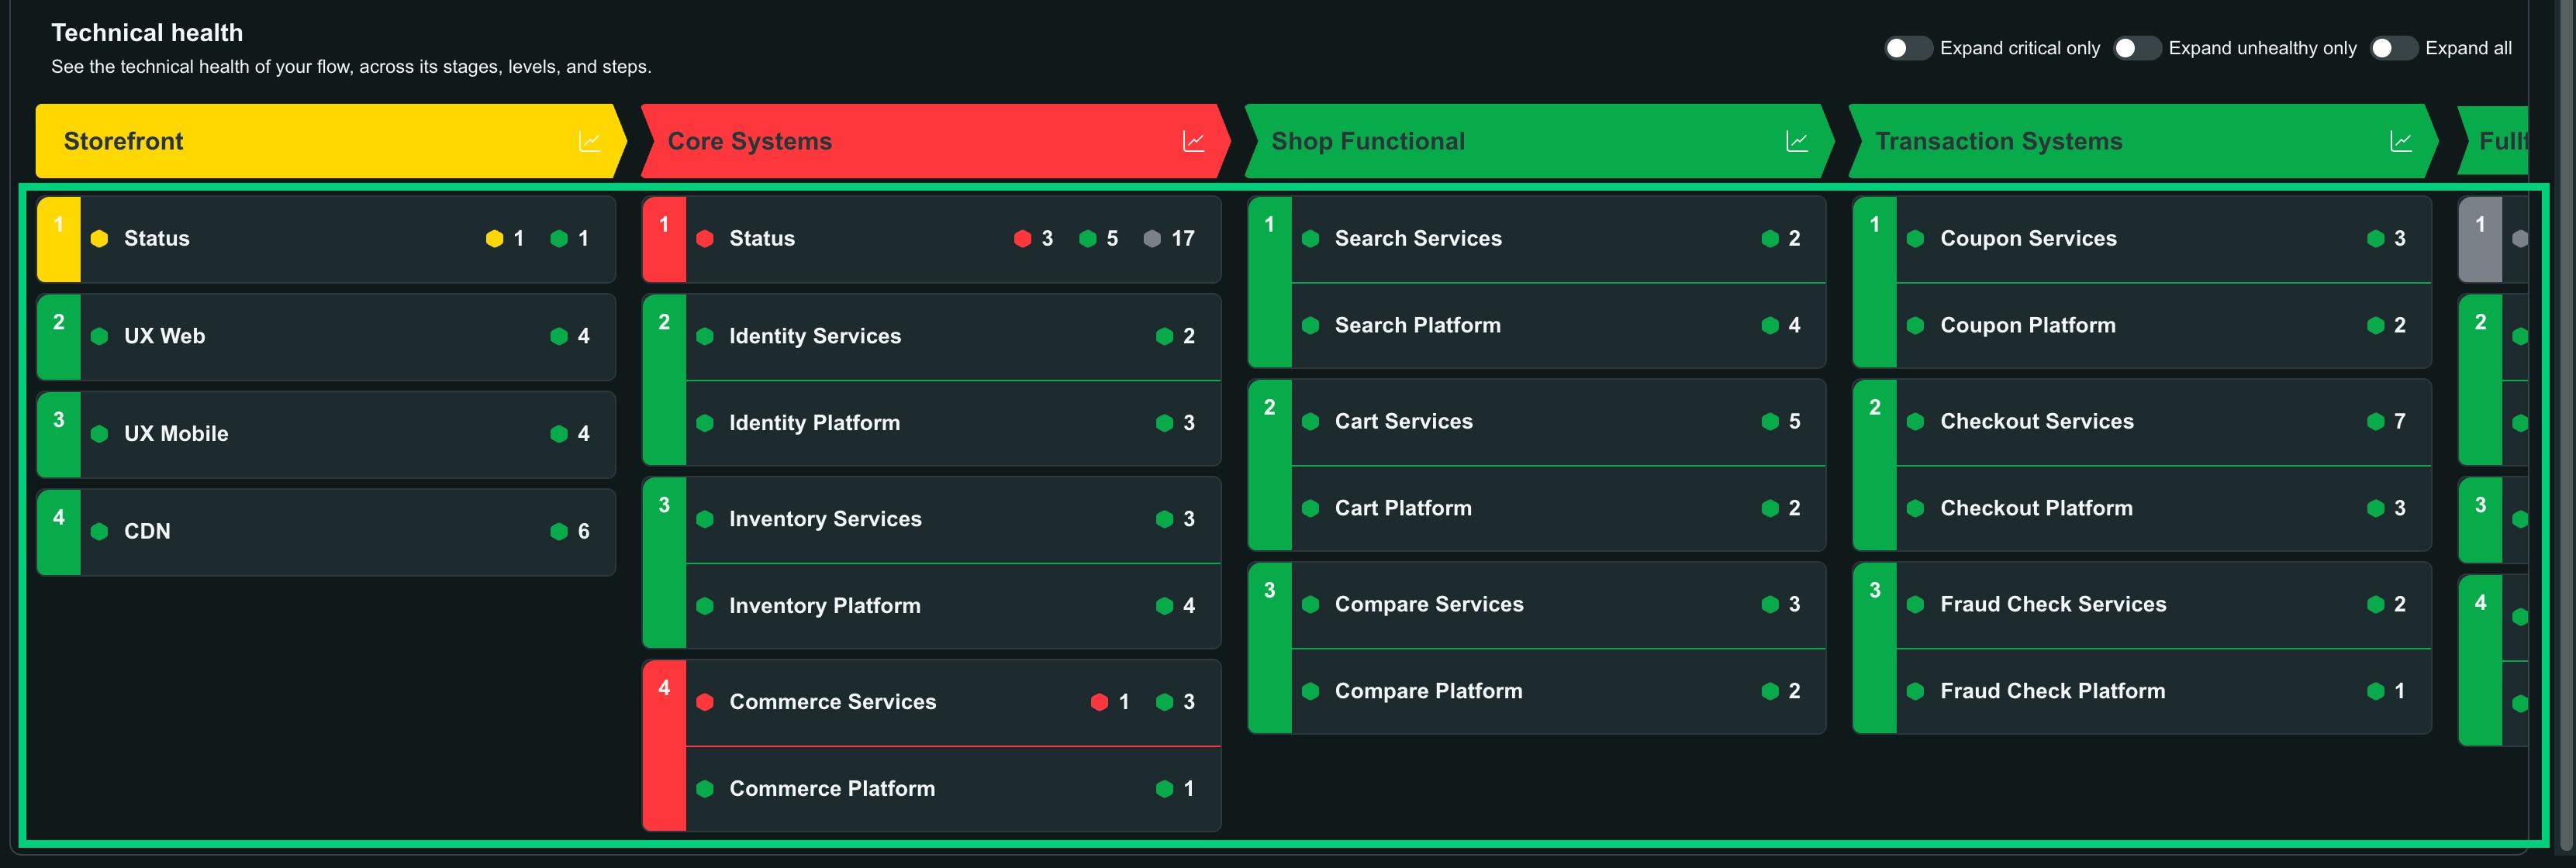
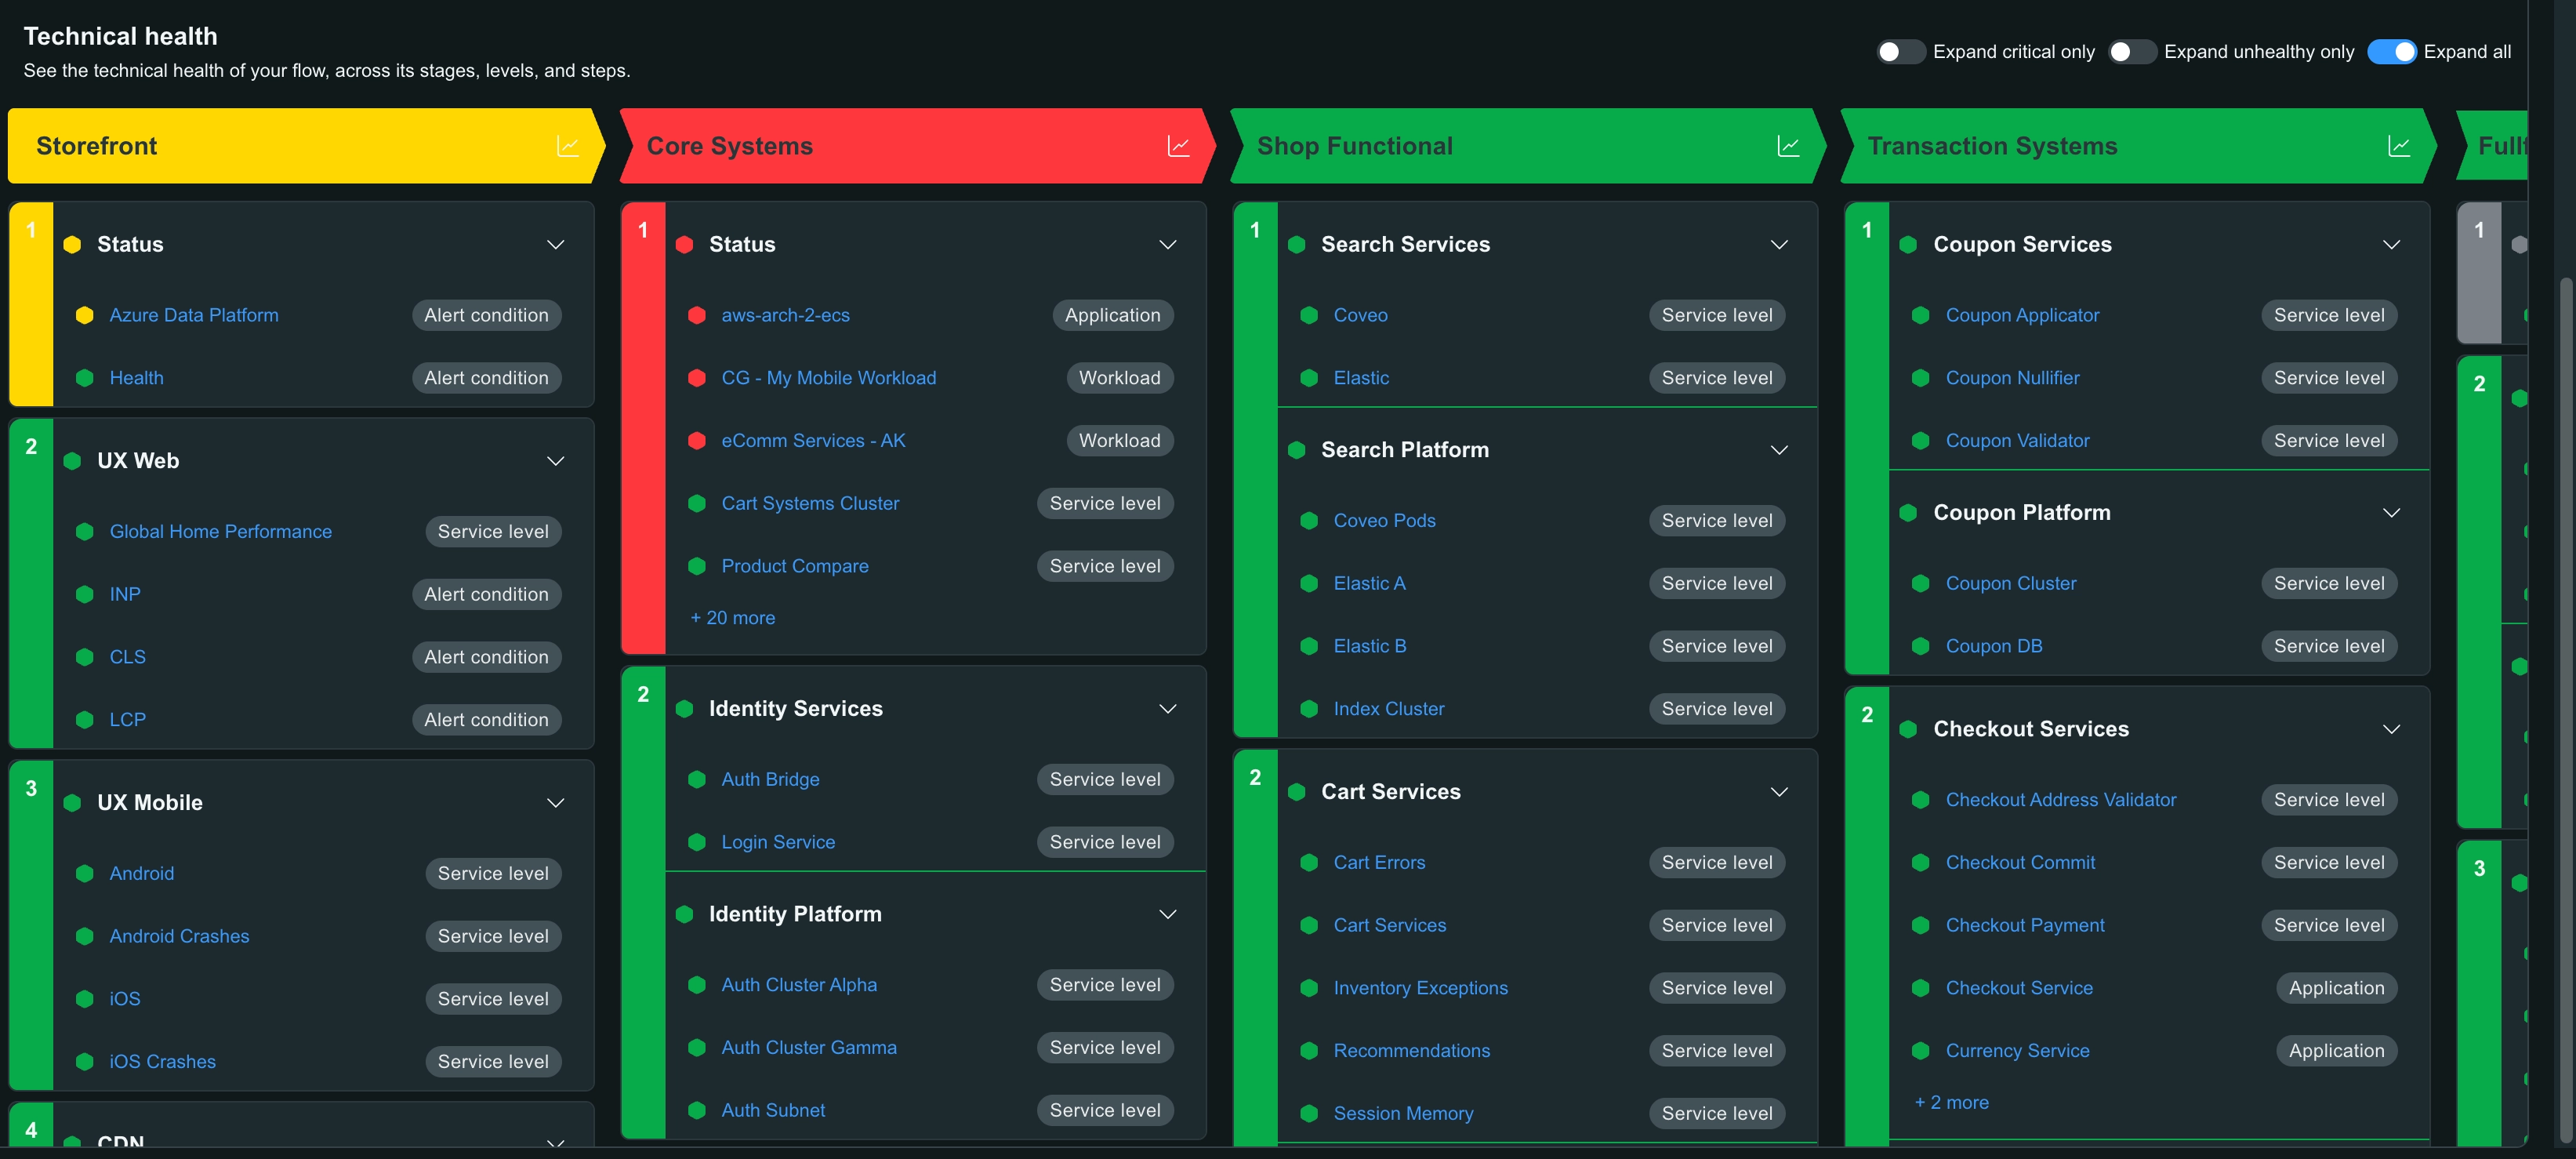
플로우 뷰의 오른쪽 상단에 있는 토글을 사용하여 상태( Expand critical only, Expand unhealthy only 또는 Expand all)에 따라 표시되는 단계와 신호를 제어하십시오. 수준 상태 롤업에서 제외된 단계는 활성화된 토글에 관계없이 숨겨진 상태로 유지됩니다.
신호 오류 표시기
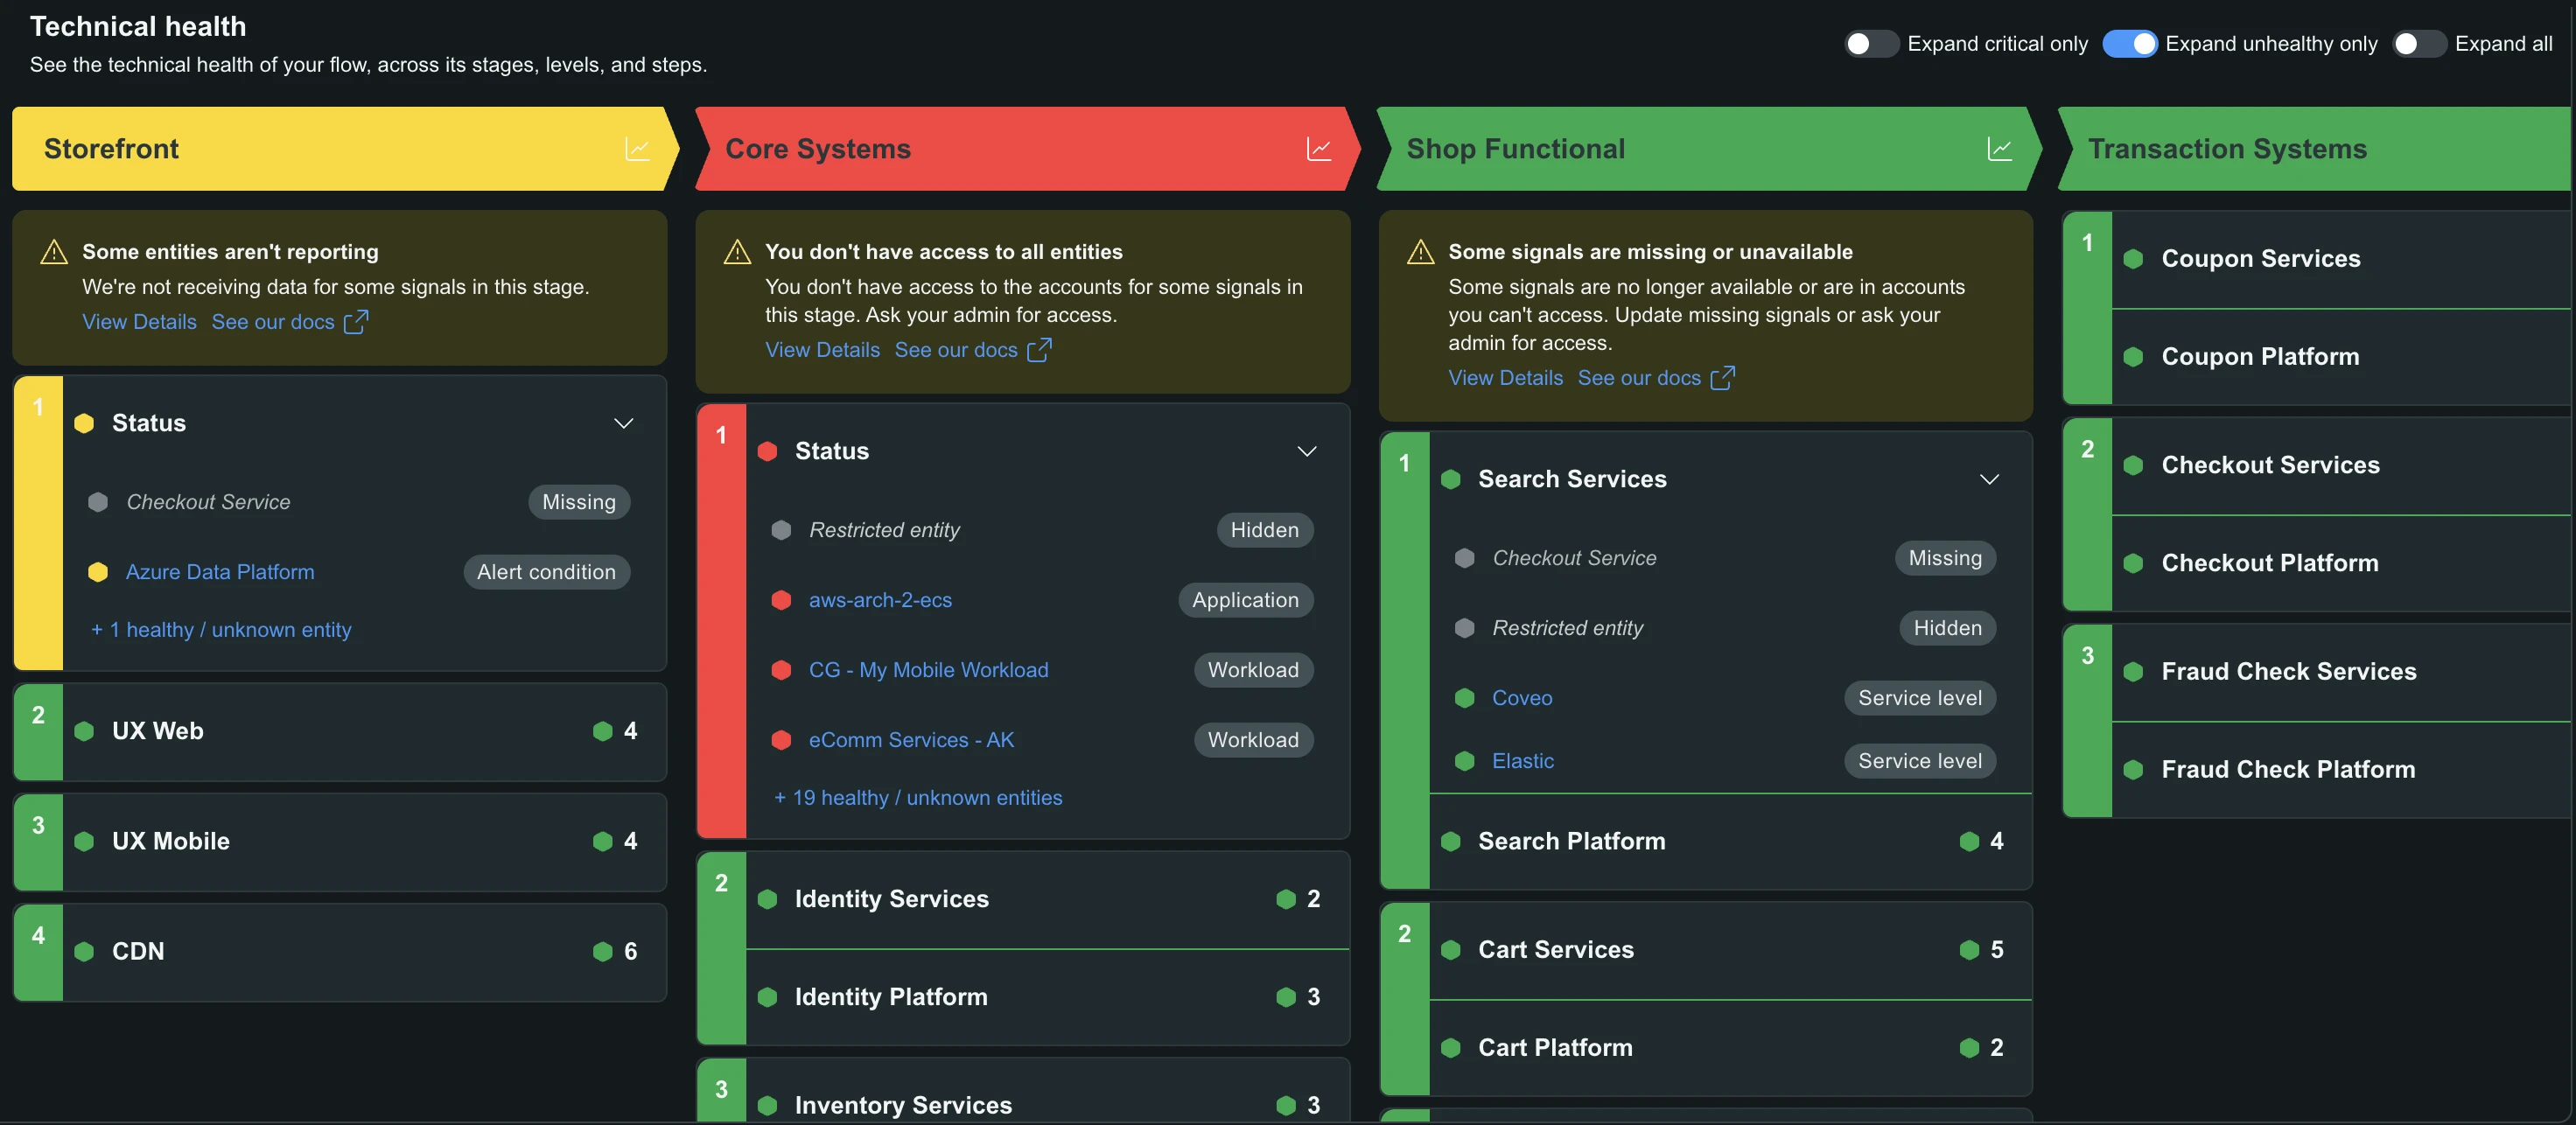
플로우를 구성하는 신호는 시간이 지남에 따라 변경될 수 있습니다. Pathpoint가 단계의 신호에서 문제를 감지하면 영향을 받는 단계의 상단에 경고 표시기가 나타납니다.
발생할 수 있는 두 가지 신호 경고는 다음과 같습니다:
- Missing signals: 플로우에 포함된 신호가 뉴렐릭에 더 이상 존재하지 않습니다. 해당 단계의 누락된 신호 목록을 보려면 경고 아이콘을 클릭하십시오. 모달에서 Update signals을(를) 클릭하여 신호 오버레이를 열고 필요한 조정을 수행하십시오.
- No access: 사용자마다 액세스할 수 있는 데이터 범위가 다를 수 있으므로, 흐름에 액세스 권한이 없는 계정의 데이터가 포함될 수 있으며, 이 경우 해당 데이터는 사용자에게 표시되지 않습니다. 이 표시기는 순전히 정보 제공용이며, 영향을 받는 단계의 상단에 표시되어 해당 단계에서 일부 데이터만 보고 있음을 알려줍니다.
변경 사항 감사
감사 로그는 누가 언제 flow를 변경했는지 기록합니다. 무엇이 변경되었는지는 기록하지 않습니다.
이를 열려면 플로우의 오른쪽 상단에 있는 ... 메뉴에서 Audit을(를) 선택하십시오.
코드로 보기
NerdGraph 또는 Terraform을 사용하여 코드로 flow를 보고 관리할 수 있습니다. 코드 미리보기를 열려면 동일한 메뉴에서 View as code을(를) 선택하십시오.
5가지 옵션을 제공합니다:
- Terraform: 이 플로우에 대한 Terraform 설정을 확인합니다. 이를 사용하여 플로우를 코드형 인프라로 관리하고 Pathpoint 설정의 버전을 제어하십시오.
- Update with NerdGraph: 이 플로우의 현재 설정을 업데이트하는 NerdGraph 뮤테이션을 미리 봅니다.
- Create with NerdGraph: 처음부터 이 flow를 생성하는 NerdGraph 뮤테이션을 미리 봅니다. 이를 flow 생성 자동화의 시작점으로 활용하십시오.
- Query with NerdGraph: 이 플로우의 설정을 검색하는 NerdGraph 쿼리를 미리 봅니다. Pathpoint 데이터를 기반으로 감사를 수행하거나 통합을 구축하는 데 유용합니다.
- Export as JSON: 플로우를 JSON으로 내보냅니다.
전체 참조는 NerdGraph 튜토리얼: Pathpoint 흐름 생성 및 관리 및 newrelic_pathpoint_flow Terraform 리소스를 참조하십시오.
flow 마이그레이션
기존 버전의 Pathpoint에서 업데이트된 버전의 Pathpoint로 각 플로우를 직접 마이그레이션하거나, 설정을 내보내고 다시 생성하여 마이그레이션합니다. 원래 플로우는 그대로 유지됩니다.
플로우를 직접 마이그레이션하십시오.
- 플로우를 열고 ... 메뉴에서 Migrate to full Pathpoint capability을(를) 선택하십시오.
- Migrate to the new Pathpoint에서 타겟 계정을 선택하십시오.
- Migrate flow 을(를) 클릭합니다.
플로우 내보내기 및 다시 만들기
플로우를 열고 ... 메뉴에서 Export flow을(를) 선택하십시오.
형식을 선택하십시오:
- JSON: 백업 또는 검사에 유용한 원시 플로우 문서입니다.
- NerdGraph: 플로우를 다시 생성하는 실행 준비가 완료된 뮤테이션입니다.
- Terraform: 뉴렐릭 Terraform 공급자를 사용하여 흐름을 코드로 관리하십시오.
출력을 복사하거나 Download을(를) 클릭하십시오.
그런 다음 해당 설정에서 업데이트된 버전의 Pathpoint에 플로우를 만듭니다. 플로우 가져오기를 참조하십시오.
이전되지 않는 항목
업데이트된 버전의 Pathpoint는 이벤트 데이터에 대한 KPI를 지원합니다. 이러한 KPI는 마이그레이션되지 않습니다:
- 메트릭 데이터를 기반으로 구축된 KPI
- NRQL에 하위 쿼리가 포함된 KPI
- flow 자체 계정이 아닌 다른 계정에 속한 KPI
중요
공지 조건을 타겟으로 하는 동적 필터는 여전히 마이그레이션되지만, 업데이트된 버전의 Pathpoint에서는 동적 필터가 공지 조건을 타겟으로 할 수 없으므로 상태가 회색(알 수 없음)으로 표시됩니다.