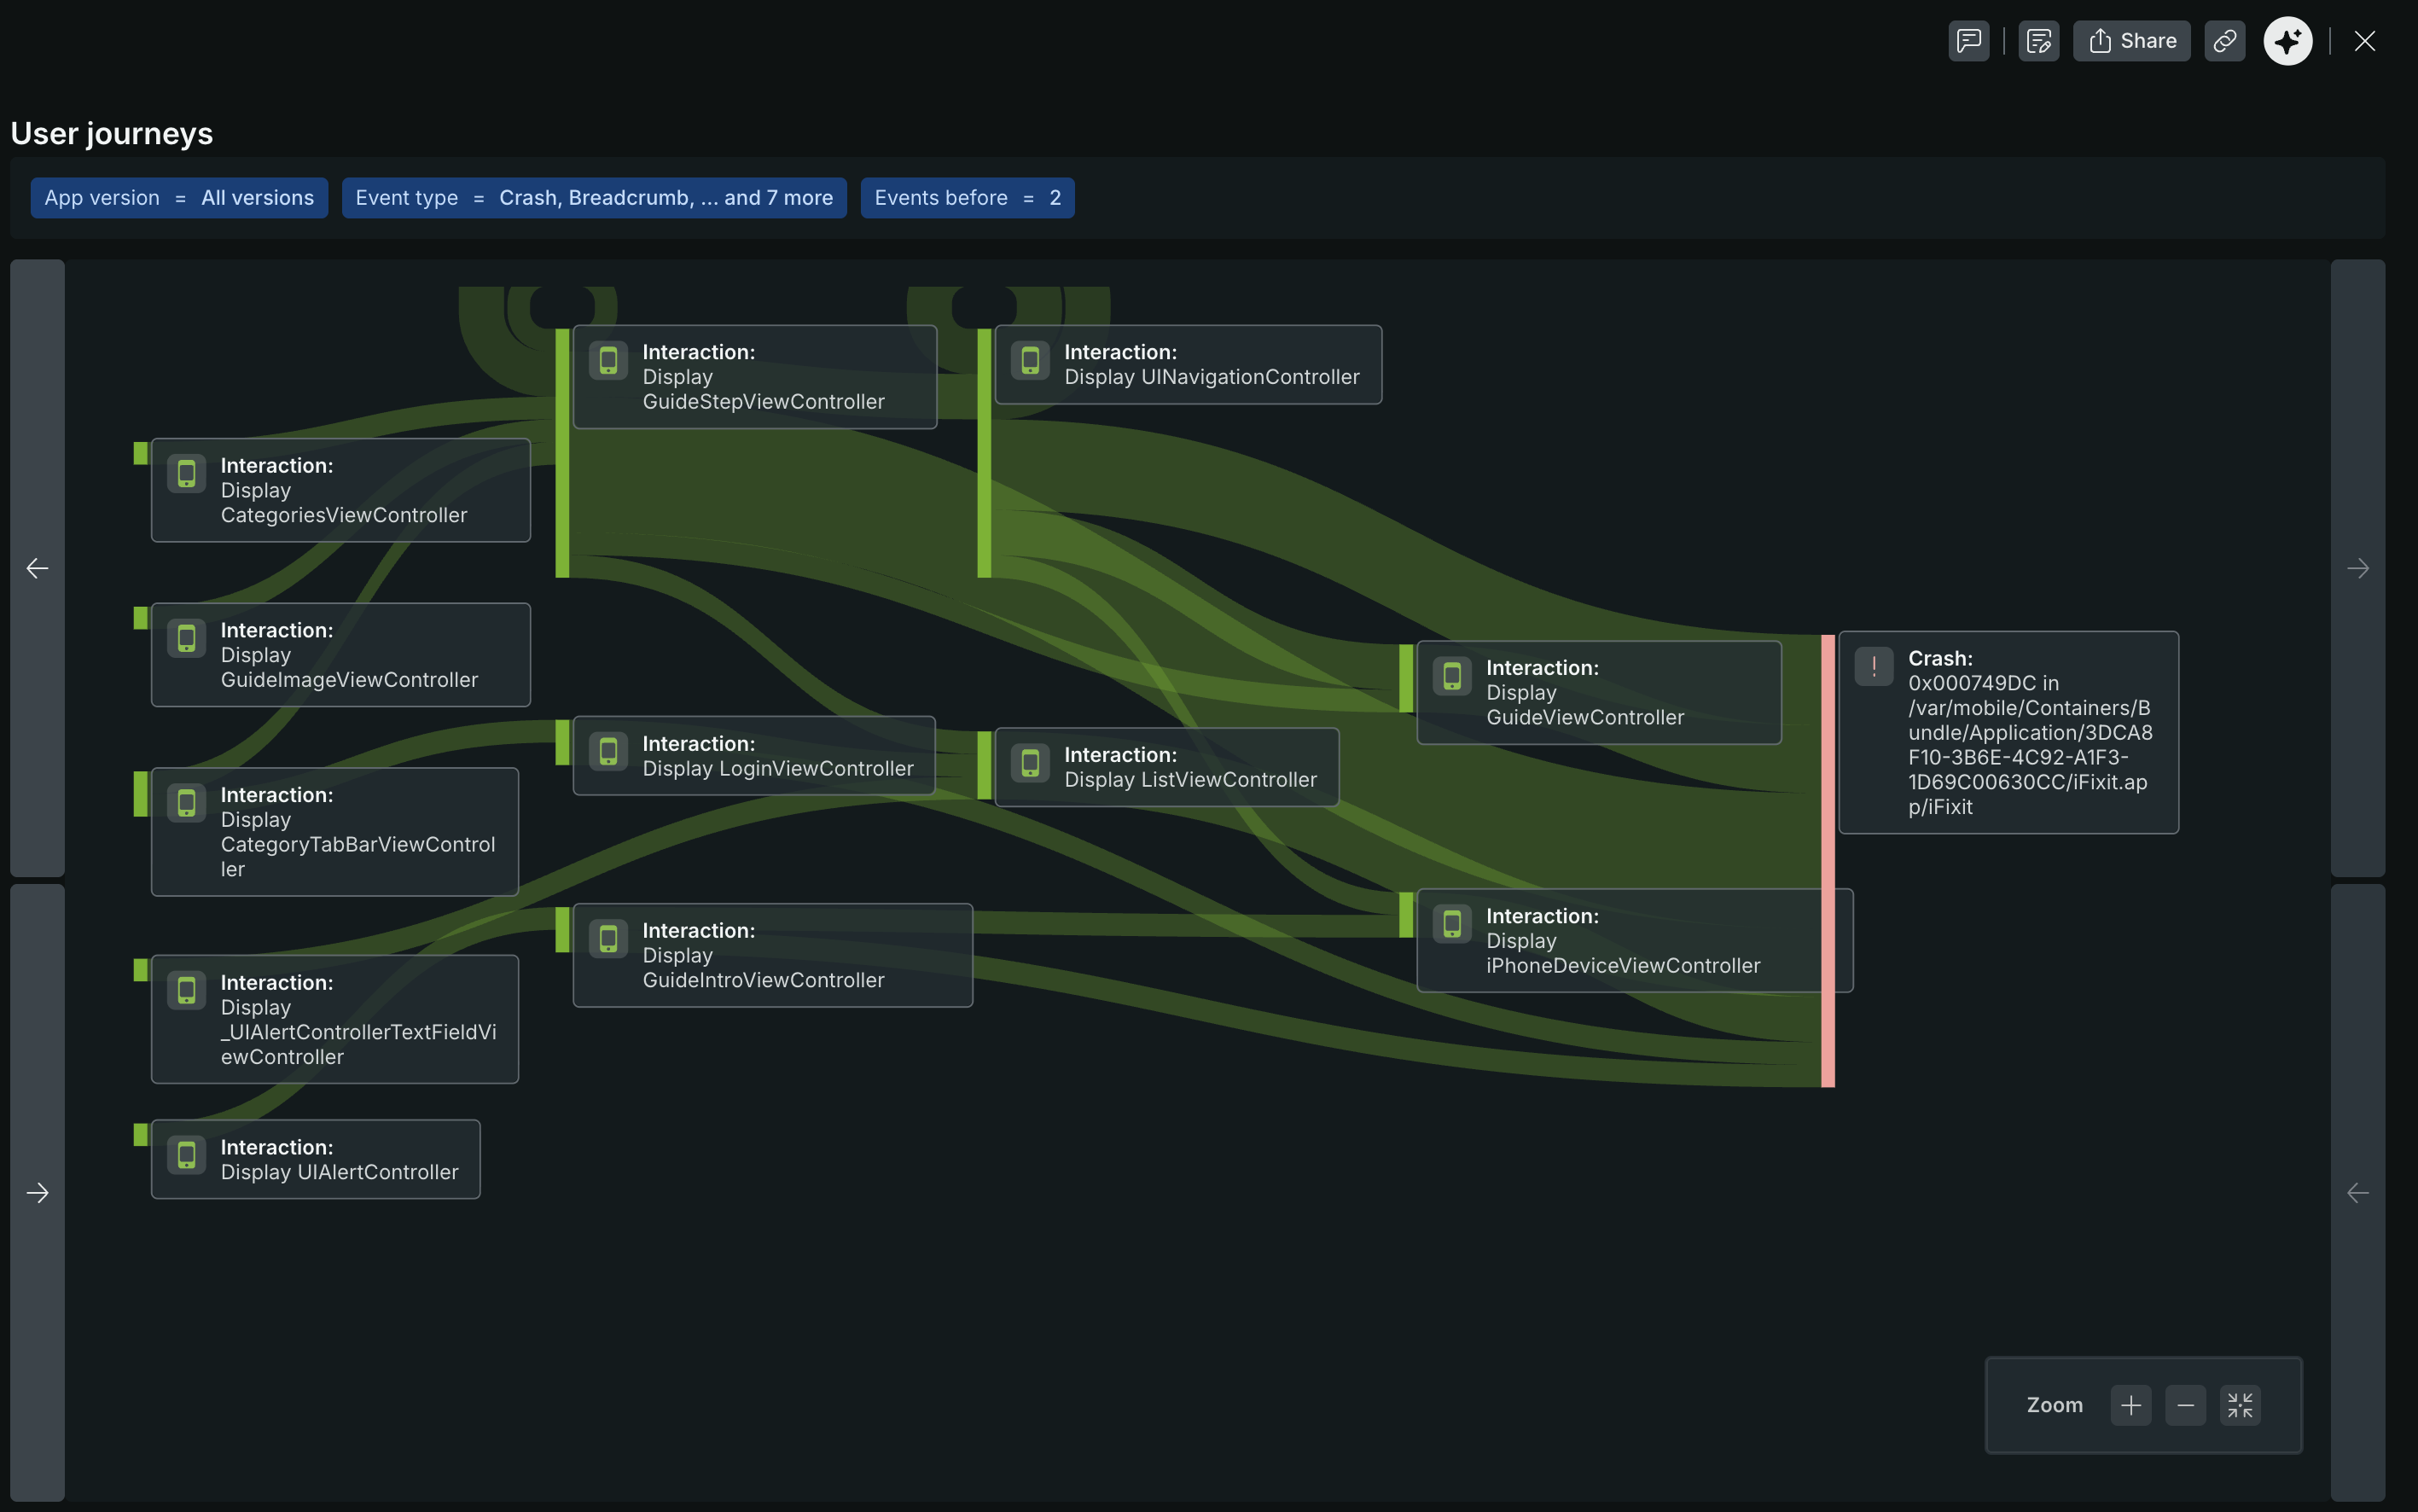
モバイルユーザージャーニーは、エンドユーザーがモバイルアプリをどのようにナビゲートするかを全体的に視覚化します。ユーザーの行動パターン — アプリを開いた後にユーザーがどこへ行くか、どこで行き詰まるか、どのパスが関心のある結果につながるか — を明らかにします。
重要
Mobile User Journeys 現在、New Relicモバイル監視UIのErrorsエクスペリエンス内で利用可能です。スタンドアロンのMobile User Journeysビュー(Browser User Journeys [Browserユーザージャーニー]機能に類似)は、将来のリリースで予定されています。
アクセス方法
Mobile User Journeys 左側のナビゲーションのTriageの下にある4つのセクション(Crashes、Request errors、Handled exceptions、ANRs)すべてで利用可能です。どこからアクセスするかによって、到達する方法は異なります:
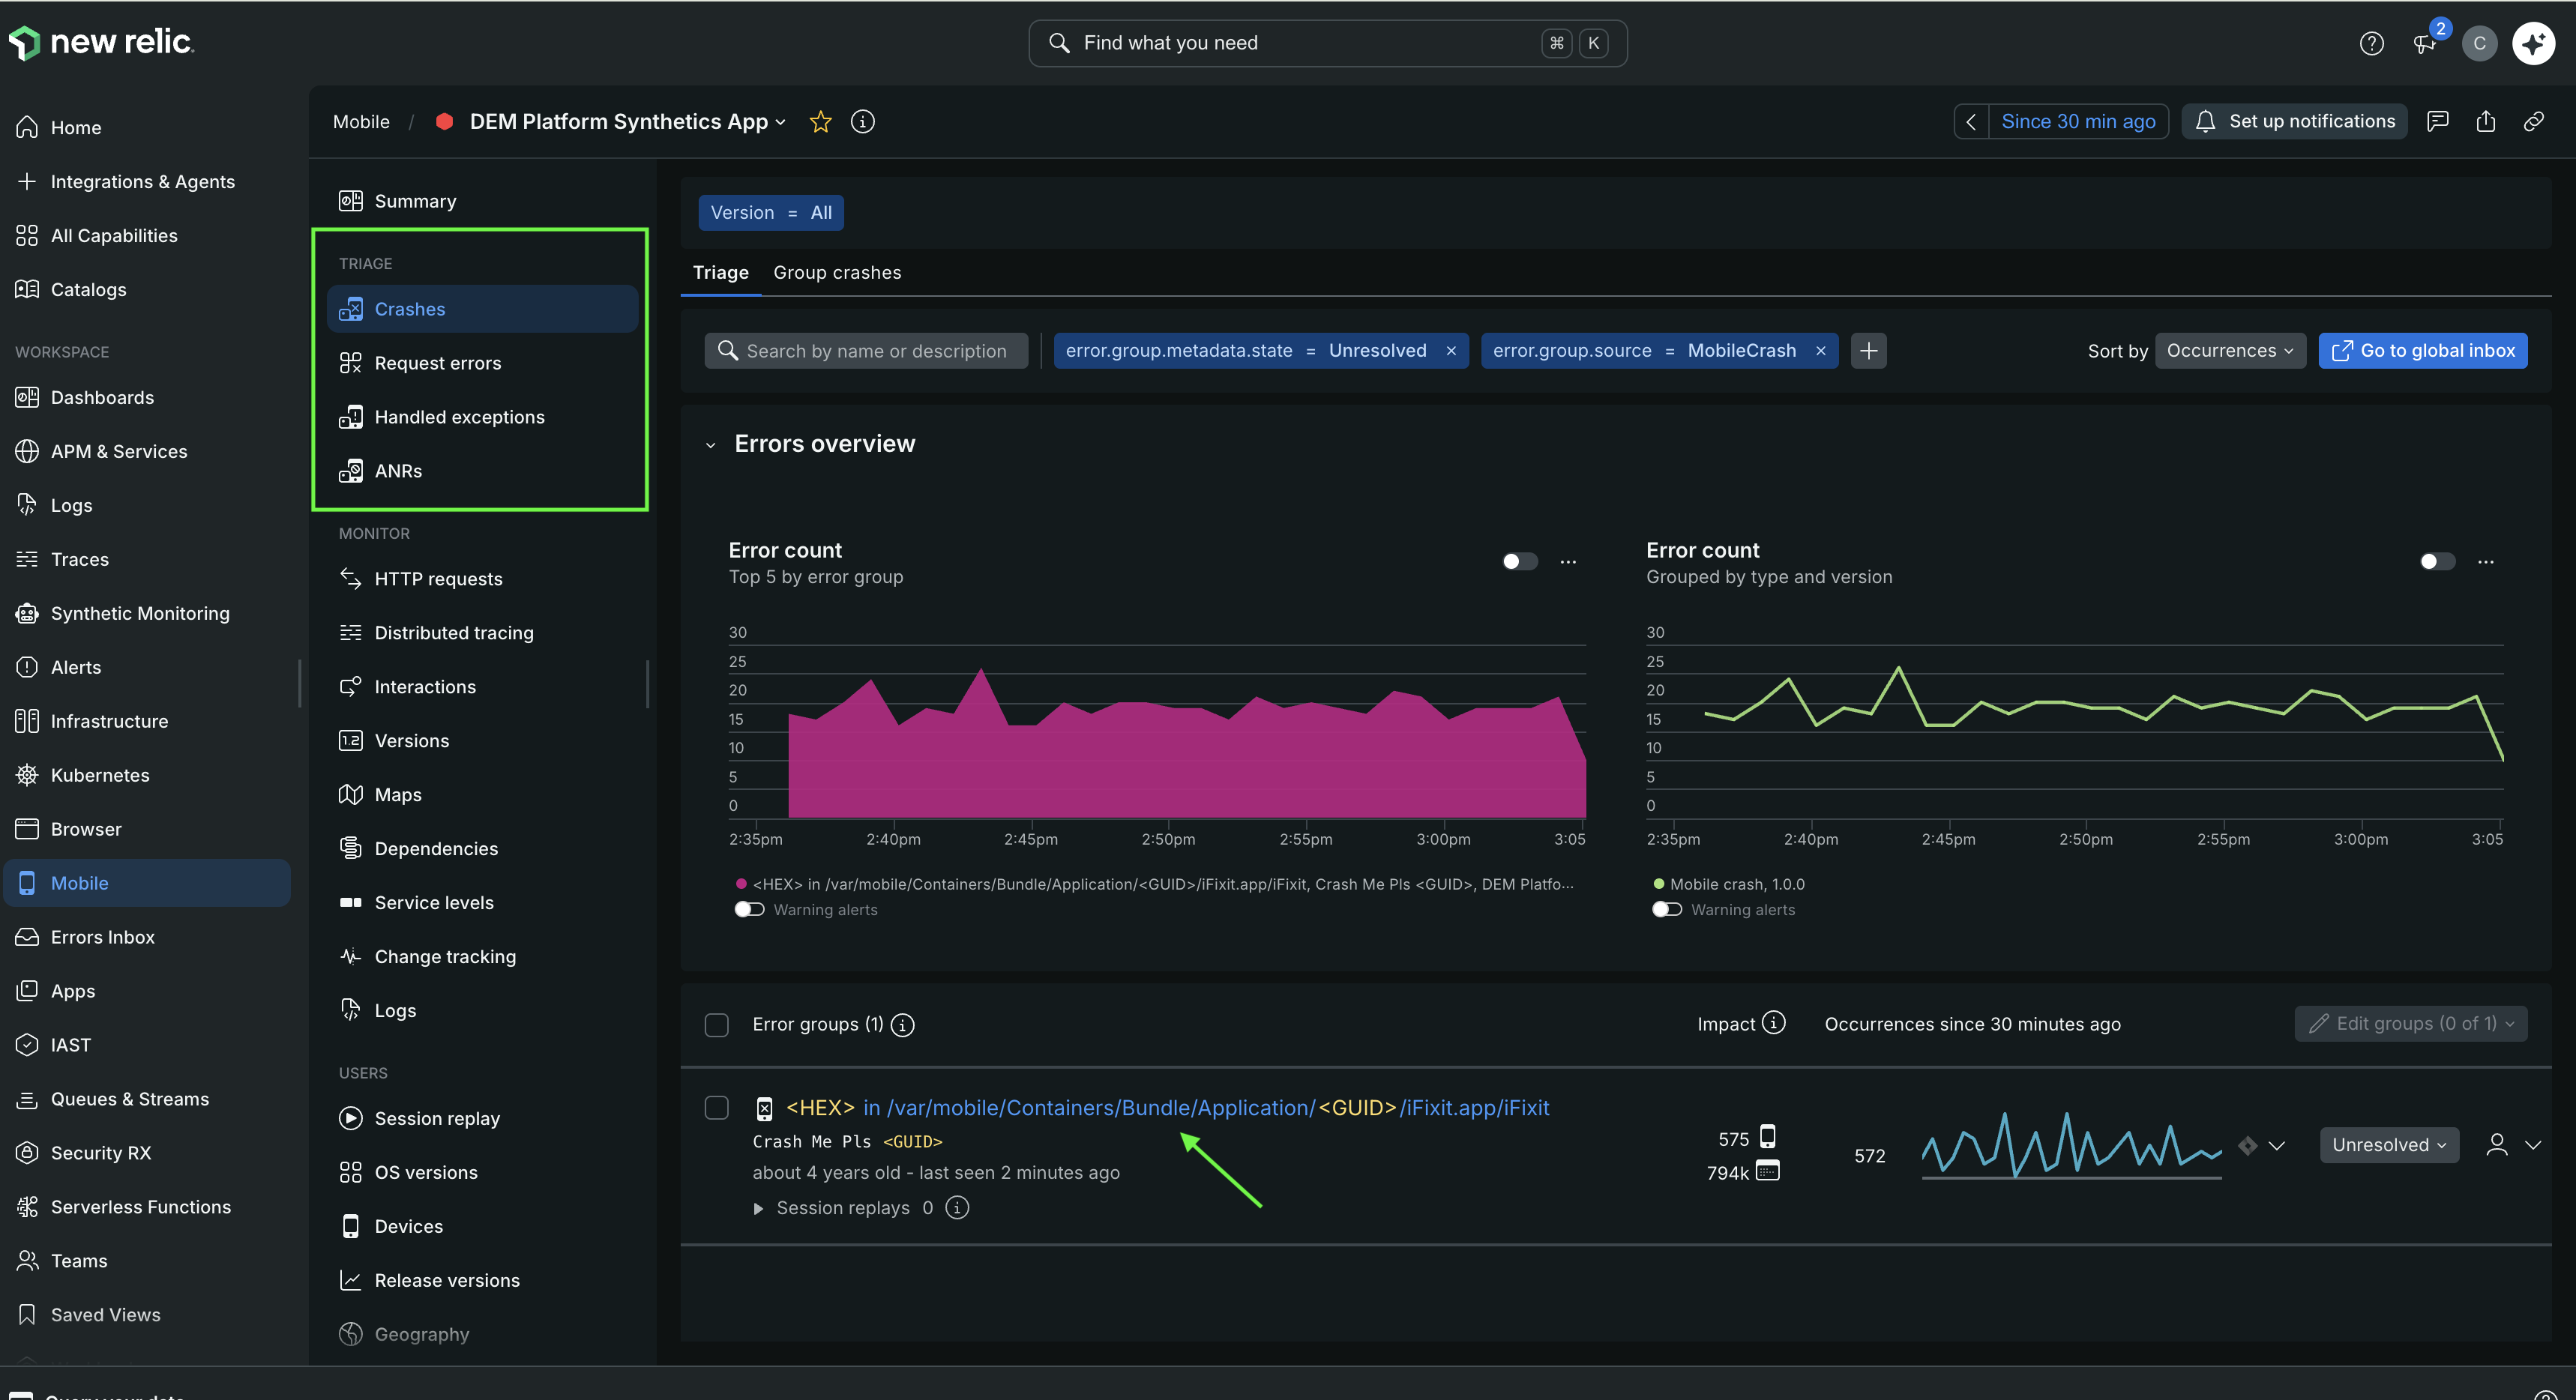
Triageタブから:
- one.newrelic.com > All capabilities > Mobileに移動します。
- モバイルアプリケーションを選択します。
- 左側のナビゲーションで、Triageの下にあるCrashesまたはRequest errorsをクリックします。
- error groupsから、調査したいものを選択してエラー詳細ビューを開きます。
- 詳細ビューで、User Journeysリンクをクリックして、エラーにつながったナビゲーションパスを表示します。
「Group crashes or error」タブから:
- one.newrelic.com > All capabilities > Mobileに移動します。
- モバイルアプリケーションを選択します。
- 左側のナビゲーションで、Triageの下にあるCrashesまたはRequest errorsをクリックします。
- Group crashesまたはGroup request errorsタブをクリックします。
- 調査するクラッシュまたはエラーグループを選択して、グループの詳細ビューを開きます。
- Triageの下にあるUser Journeysリンクをクリックして、エラーに至ったナビゲーションパスを確認します。
Mobile User Journeysの使用方法
サンキーダイアグラム
User Journeysの視覚化では、サンキーダイアグラムを使用して画面間のユーザーのフローを示します。各ノードはアプリ内の画面またはインタラクションを表し、各接続パスの幅はそのルートをたどったユーザーの数を反映しています。
ダイアグラムの主な要素:
- Nodes: アプリ内の個々の画面またはインタラクション。
- パス: ノード間の接続であり、そのパスをたどったユーザーの数に比例したサイズになります。
- エントリポイント: ユーザーセッションが開始される画面です。
- 離脱ポイント: ユーザーがセッションを終了した、またはエラーをトリガーした画面。
エラーグループ内から表示すると、ビジュアライゼーションはそのエラーが発生したセッションに自動的に固定されるため、クラッシュの前に発生したナビゲーションパスをトレースできます。
パスとイベントの詳細
ダイアグラム内の任意のノードまたはパスをクリックすると、その正確なルートをたどったセッションにドリルダウンします。これにより、2つのパネルを持つ分割ビューが開きます:
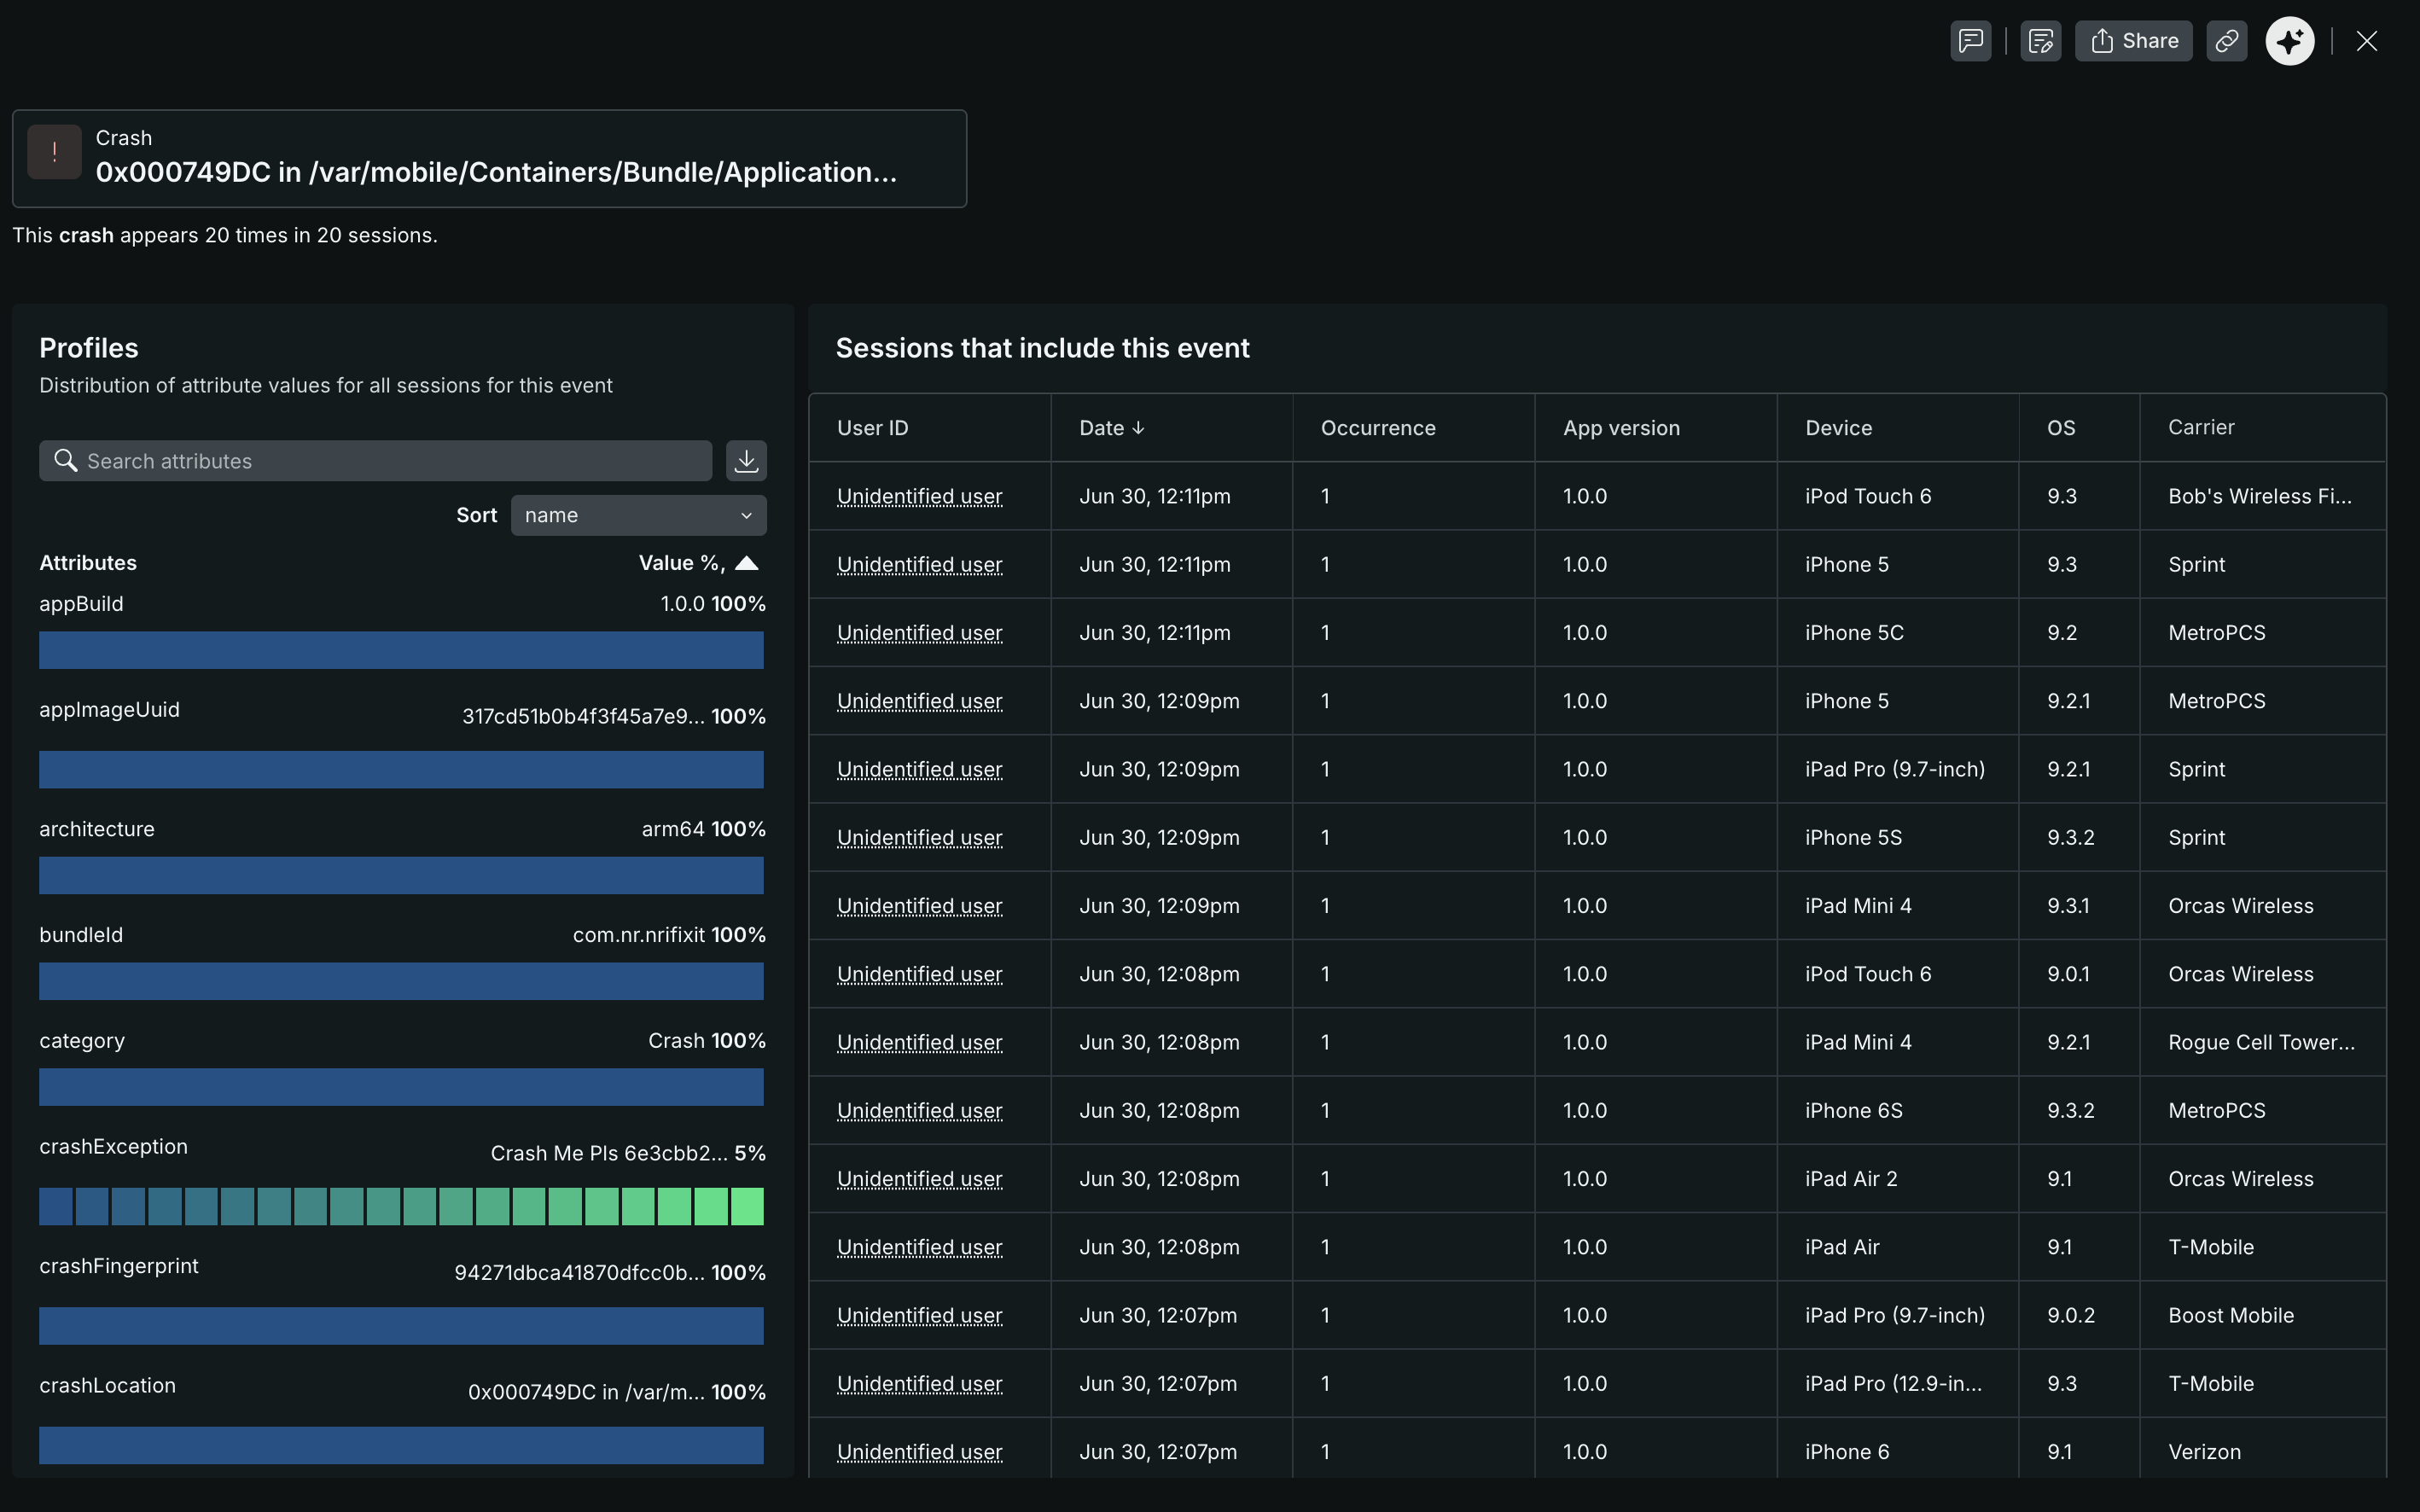
- Profiles: 選択したパスをたどったセッション全体での属性値(アプリのバージョン、デバイス、OS、アーキテクチャー、クラッシュの詳細など)の分布を示します。これを使用して、影響を受けたユーザー間の共通点を特定します。
- Sessions that include this event: ユーザーID、日付、発生回数、アプリのバージョン、デバイス、OSバージョン、キャリアなど、個々のセッションをリストするテーブル。任意のセッションをクリックして、Event Trail Drilldownページを開きます。
イベントトレイルのドリルダウン
セッションテーブル内のセッションをクリックしてEvent Trail Drilldownページを開きます — そのセッションで記録されたすべてのイベントの時系列のタイムラインです。
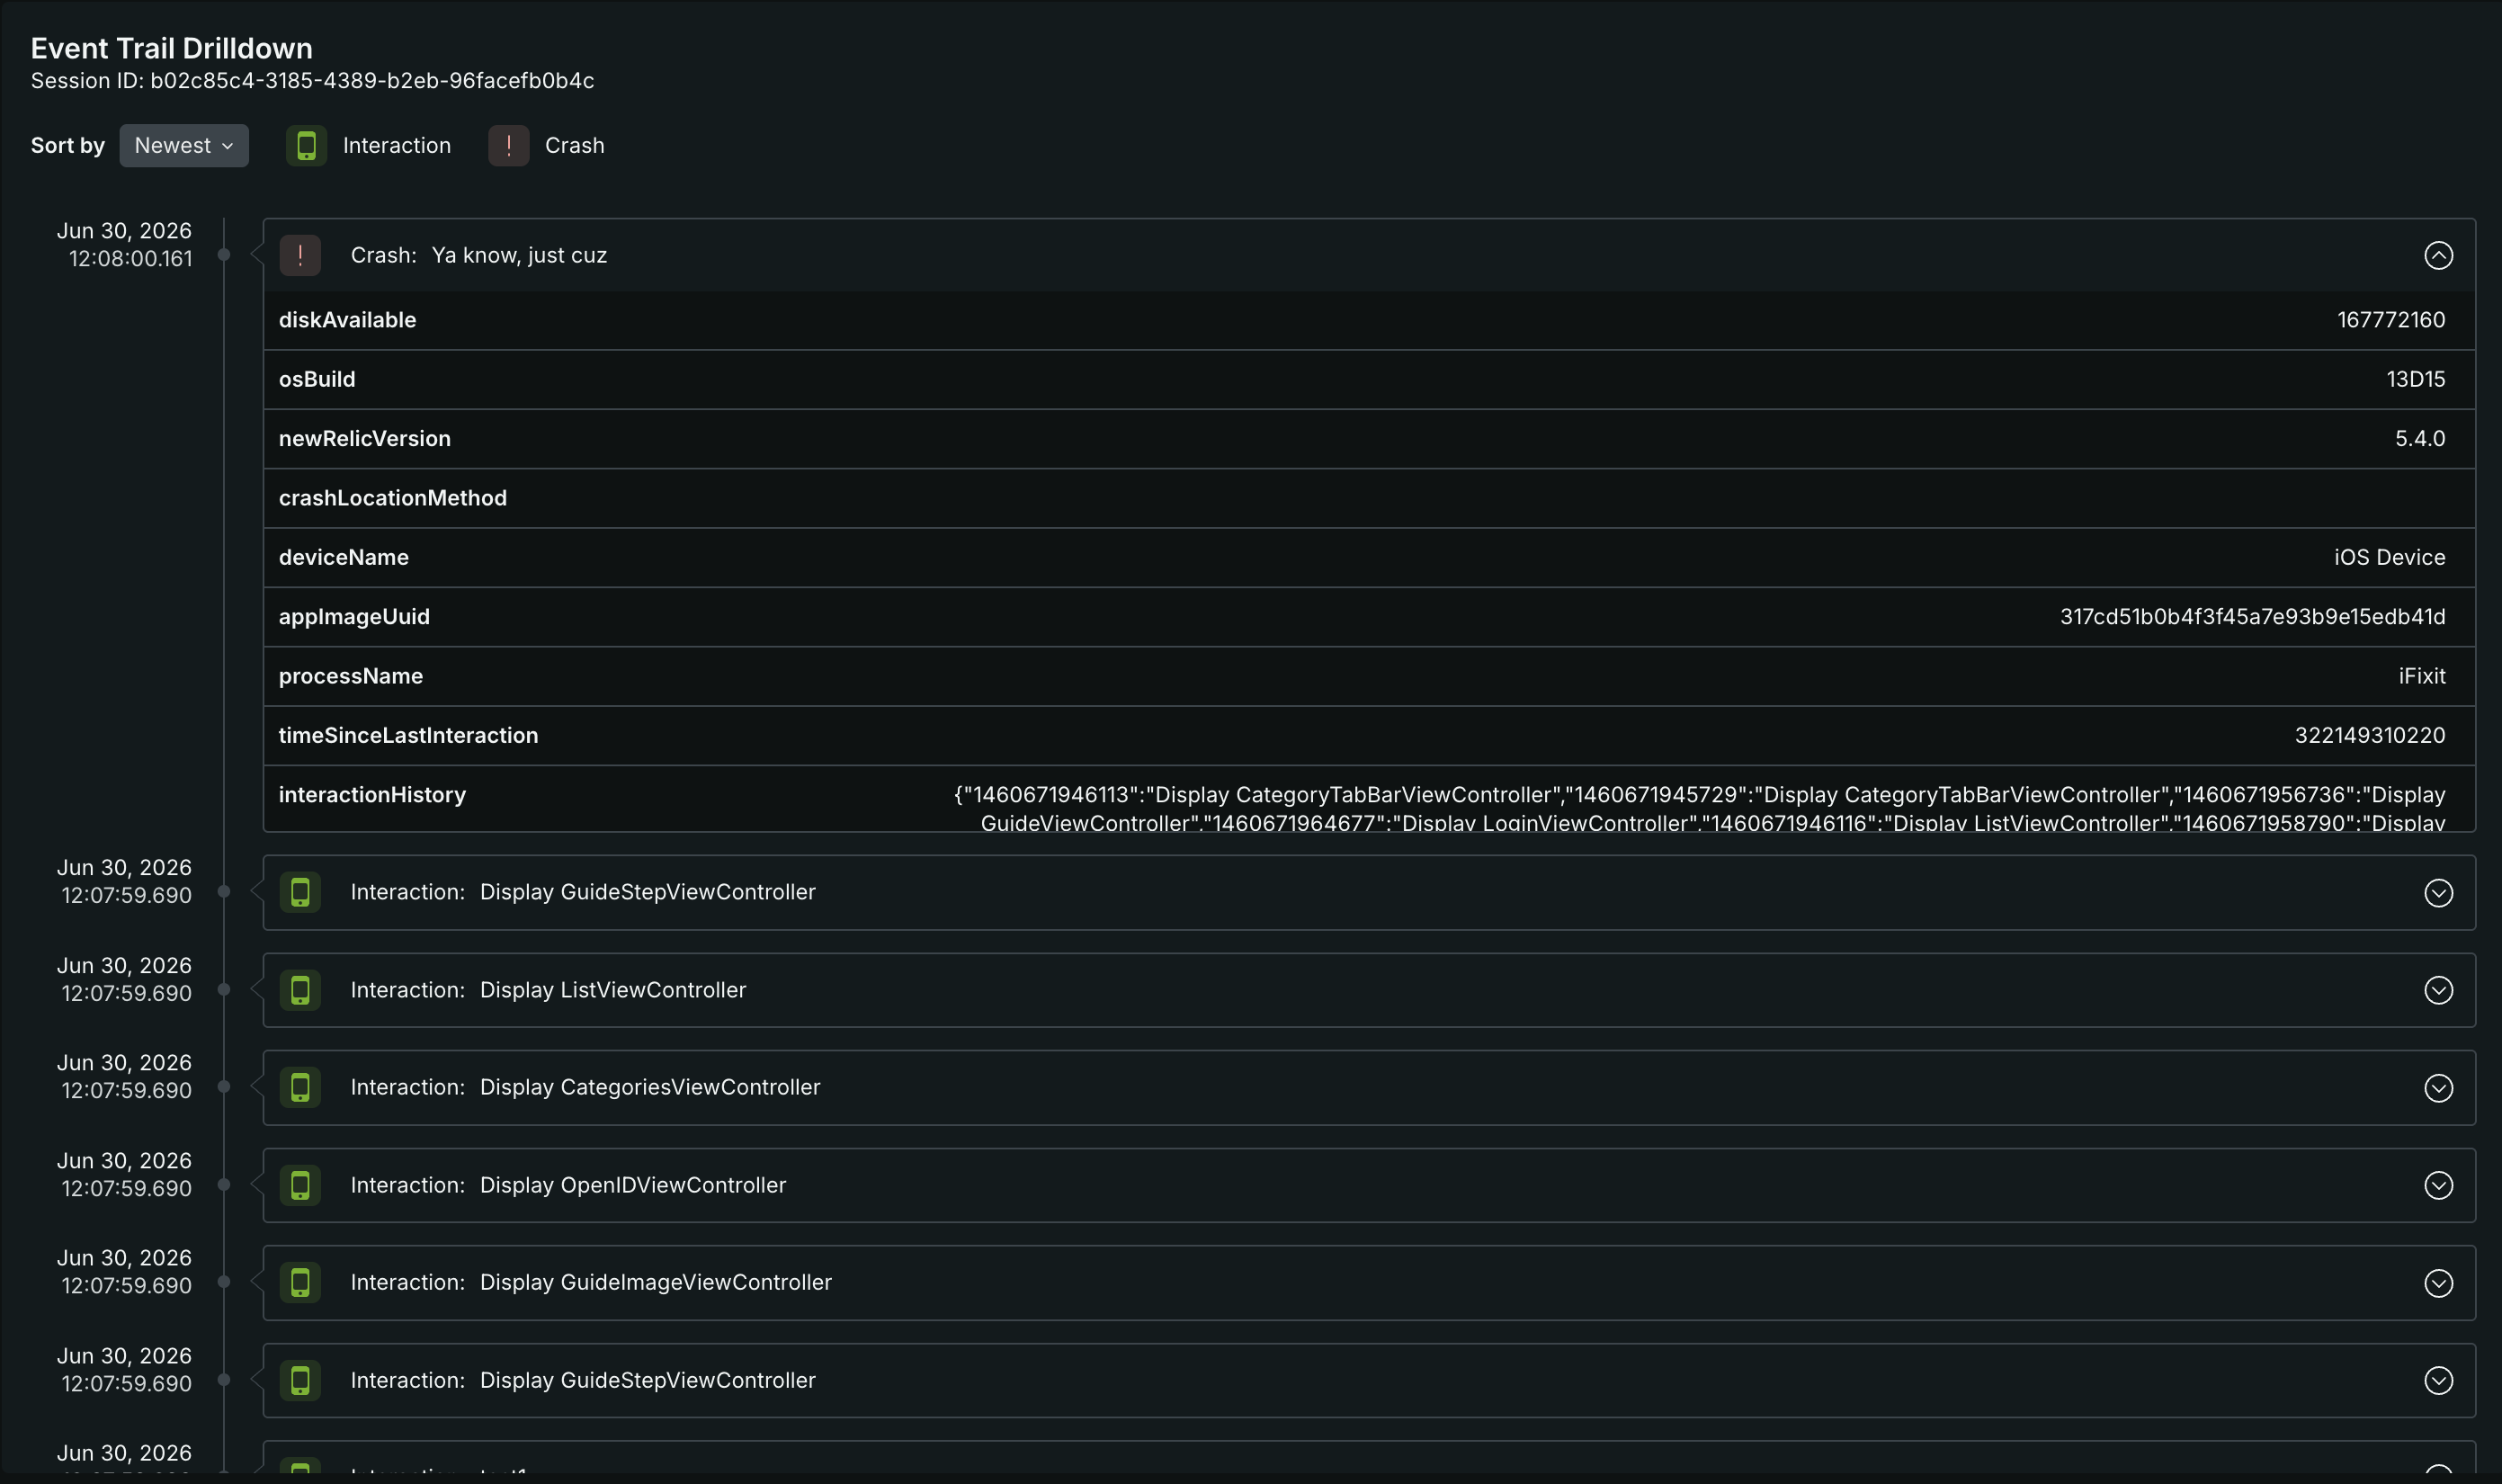
Event Trail Drilldownでは、次のことができます:
- Filter by event type: InteractionボタンとCrashボタンを使用して、特定のイベントタイプに焦点を当てます。
- Expand event details: 任意のイベントをクリックすると、完全な属性ペイロードが表示されます — これには、
diskAvailable、osBuild、processName、timeSinceLastInteraction、interactionHistoryなどのクラッシュメタデータが含まれます。
このビューを使用すると、クラッシュが発生する前にユーザーが実行した正確な手順を、個々の画面インタラクションに至るまで再構築できます。
視覚化のカスタマイズ方法
イベントタイプフィルター
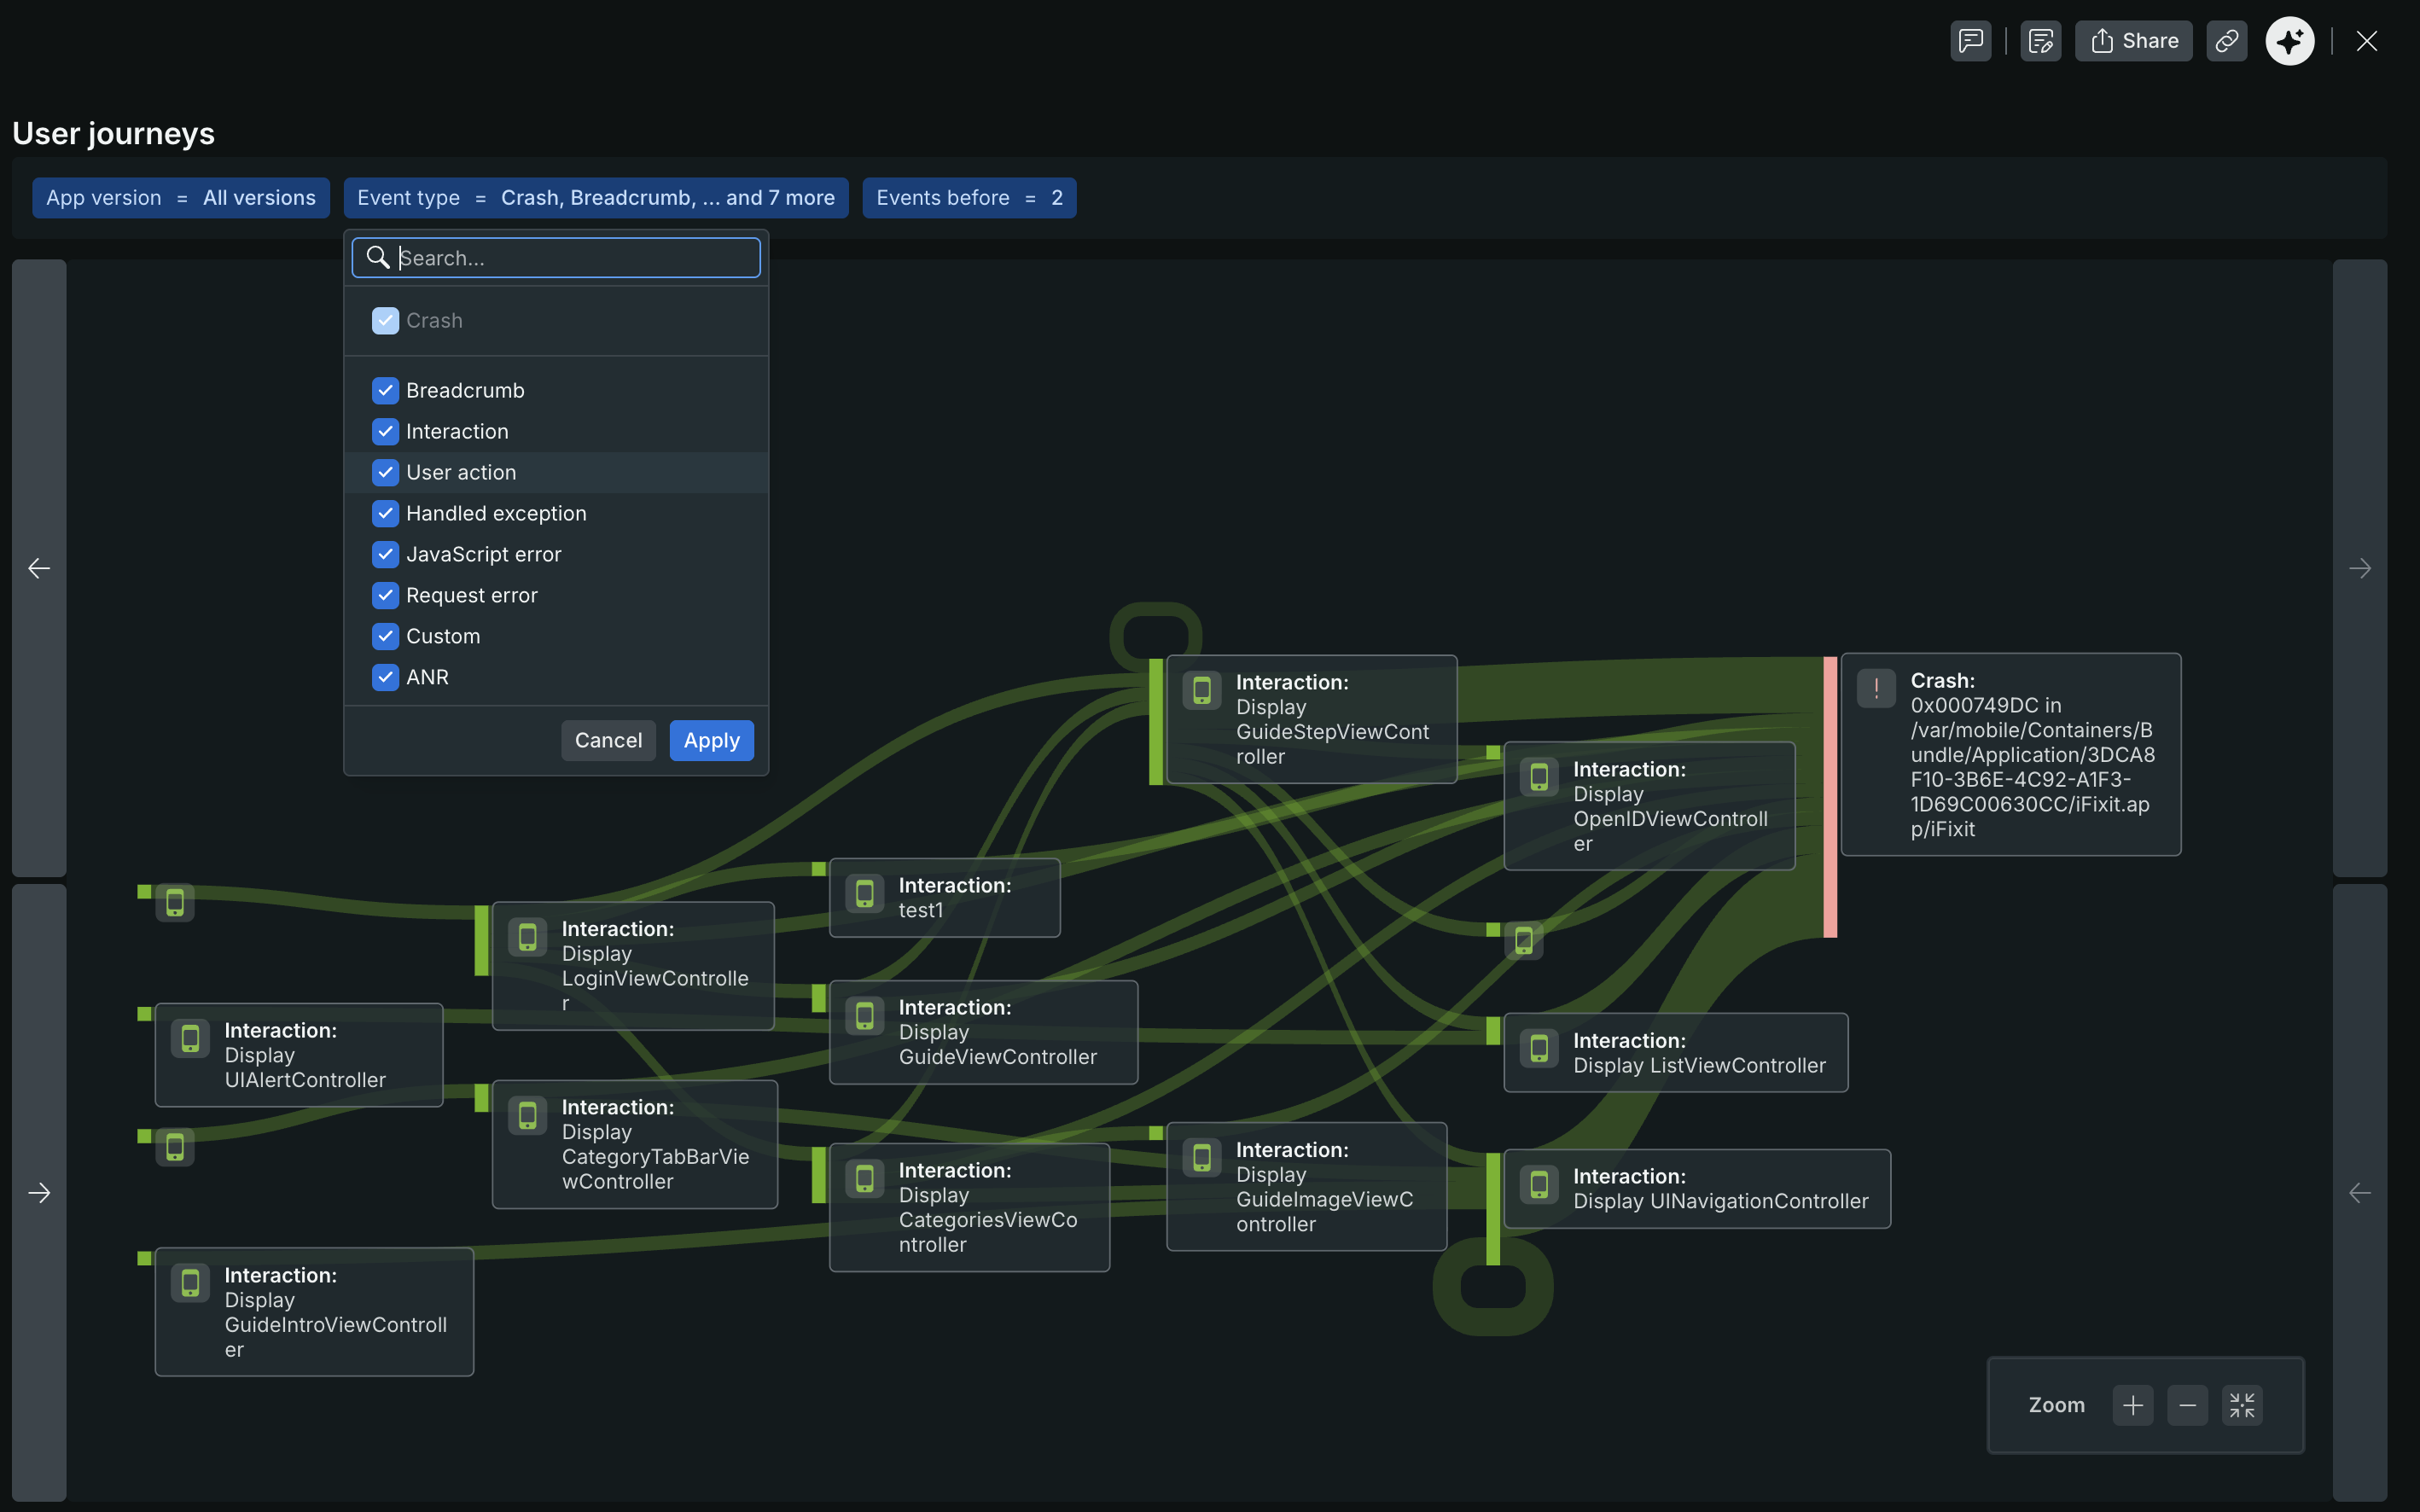
Event typeフィルターを使用して、ダイアグラム上のノードとして表示するイベントタイプを選択します。以下の任意の組み合わせを含めることができます:
- Crash [クラッシュ]
- ブレッドクラム
- Interaction [インタラクション]
- User action [ユーザーアクション]
- Handled exception [ハンドルされた例外]
- JavaScript error [JavaScriptエラー]
- Request error [リクエストエラー]
- カスタム
- ANR
アプリバージョン
App versionフィルターを使用して、特定のリリースからのジャーニーに焦点を当てます。これは、デプロイメントの前後のユーザーの行動を比較して、リグレッションや改善を特定するのに役立ちます。
ユーザー属性でフィルタリング
フィルターバーを使用して、デバイスタイプ、OSバージョン、地域などの追加の属性、またはMobile SDKでインストゥルメントされたカスタムアトリビュートによって結果を絞り込みます。
関連機能
- モバイルクラッシュ:モバイルアプリ全体のクラッシュグループを表示してトリアージします。
- 処理済みの例外: 致命的ではないエラーと傾向を追跡します。
- セッションリプレイ:実際のユーザーセッションの録画を視聴して、正確なユーザーの行動を理解します。
- Browser User Journeys: BrowserでモニターされるWebアプリ向けの同等のUser Journeys機能。