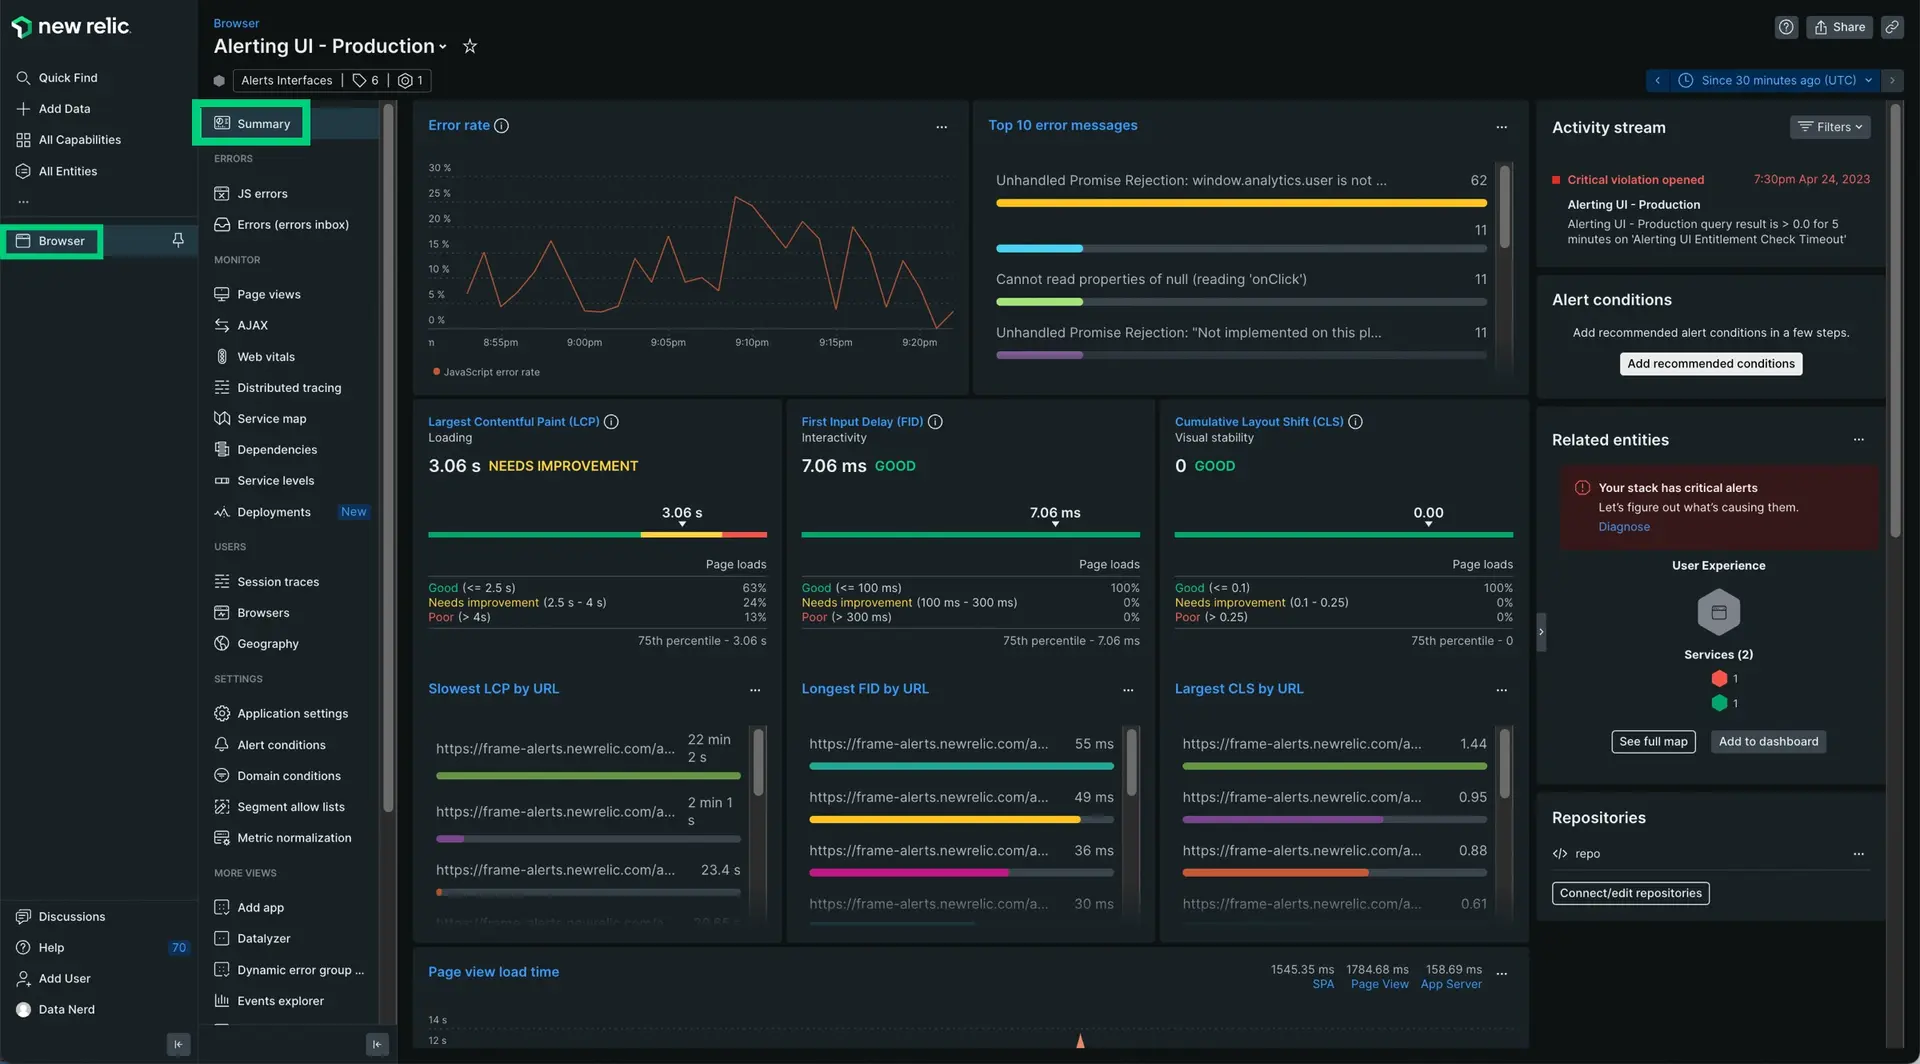
Summary ページは、アプリの実際のユーザーbrowserパフォーマンスに関する問題のトラブルシューティングに役立ちます。 Summaryページを使用して次のことを行います。
- 最大コンテンツフル ペイント (LCP)、次のペイントへのインターラクション (INP)、累積レイアウト シフト (CLS) など、コアウェブバイタルが一目でわかります。
- アプリのブラウザー側のパフォーマンスの傾向を表示します。
- ページの読み込みタイミングの問題をすばやくトラブルシューティングします。
- 他のブラウザUIページに直接移動して、問題や問題をより詳細に調べます。
- 推奨アラート条件を追加します。
サマリーページの表示
ブラウザー アプリのパフォーマンスの概要を表示するには:
one.newrelic.com > All Capabilities
に移動します。
クリック
Browser
ブラウザ アプリを選択します。

コアウェブバイタルデータを使用してSEOを改善する
Core web vitalsbrowserグラフを使用して、 Google のコアウェブバイタル に従って パフォーマンスを理解します。これらには次のものが含まれます。
- LCP:ローディングパフォーマンスを測定する最大の満足のいくペイント
- INP: インタラクションから次のペイントへ。ユーザーの入力とbrowser応答の間の対話性を測定します。
- CLS:ブラウザページの視覚的な安定性を測定する累積レイアウトシフト
より高いスコアは、組織がお金を節約し、SEOに影響を与えるのに役立ちます。スコアが低いと、組織のWebサイトに対するユーザーの認識に影響を及ぼし、顧客の不満やビジネスチャンスの喪失につながる可能性があります。
コア Web バイタルの監視の詳細については、コア Web バイタルのガイドを参照してください。
ユーザーエクスペリエンスを評価する
コアWebバイタルデータを含むグラフに加えて、次のデータを使用して、アプリでのユーザーエクスペリエンスを評価します。
User time on the site
User-centric page load times
および
Longest interaction to next paint by URL
:ページ読み込みタイミング プロセスの詳細を確認するには、グラフのタイトルをクリックして、
UIに直接移動します。
ブラウザのパフォーマンスの問題を特定する
これらのチャートを使用して、ブラウザーに関連するパフォーマンスの問題を特定します。
Initial page load and route change
: このグラフは、URL のロードまたはリロードに起因する従来の URL 変更のロード時間を示しています。 詳細を確認するには、グラフのタイトルをクリックして、
UIに直接移動します。
Throughput
: このグラフは、 browserループットを 1 分あたりのページ数 (ppm) で示します。 該当する場合、このグラフにはシングルページ アプリ (SPA) データも表示されます。 詳細を確認するには、グラフのタイトルをクリックして、
UIに直接移動します。
Page views with JavaScript errors
: 詳細を確認するには、グラフのタイトルをクリックして、
UIに直接移動します。
他の何かによって引き起こされた問題を調べます
パフォーマンスの問題は、ブラウザに関連している場合もあれば、他の問題に関連している場合もあります。ブラウザのパフォーマンスに影響を与える可能性のあるその他の問題の詳細については、以下を確認してください。
Frontend vs. backend
: このチャートは、接続された
サービス アプリケーションにリンクしています。 ディストリビューティッド(分散)トレーシングの詳細を確認するには、チャートのタイトルをクリックしてください。
First interaction by device type
(デスクトップ、タブレット、モバイル) および
First interaction by user agent
: 詳細を表示するには、グラフのタイトルをクリックして、
UIに直接移動します。
Related entities
: このウィジェットは、パフォーマンスの問題が に接続する エンティティ browserの問題によって引き起こされているかどうかを判断するのに役立ちます。
View synthetic monitors
: 外形監視はユーザーのトラフィックをシミュレートできます。 このリンクは、重要なエンドポイントに関連する機能停止やパフォーマンスの低下を、顧客が気づく前に事前に検出して解決するのに役立ちます。
推奨アラート条件を追加
ブラウザ監視のSummaryページを通じて、推奨されるアラート条件をエンティティに追加できます。
さらに未検出のエンティティを確認したい場合は 、「アラート カバレッジ ギャップと条件の推奨事項」 ページを参照してください。
推奨されるアラート条件を追加するには、次の手順に従います。
ブラウザ監視Summaryページを開きます。
Add recommended conditionsをクリックします。

推奨されるアラート条件をいくつか選択します。

Nextをクリックします。
通知を受け取るポリシーを選択します。既存のものを選択するか、 新しいものを作成できます。
Activate conditionsをクリックします。