Install the .NET agent

New Relic supports the most popular .NET application implementations. Once installed, our .NET APM agent monitors your app's performance and gives you insight into that performance. Want more context? See Introduction to APM.
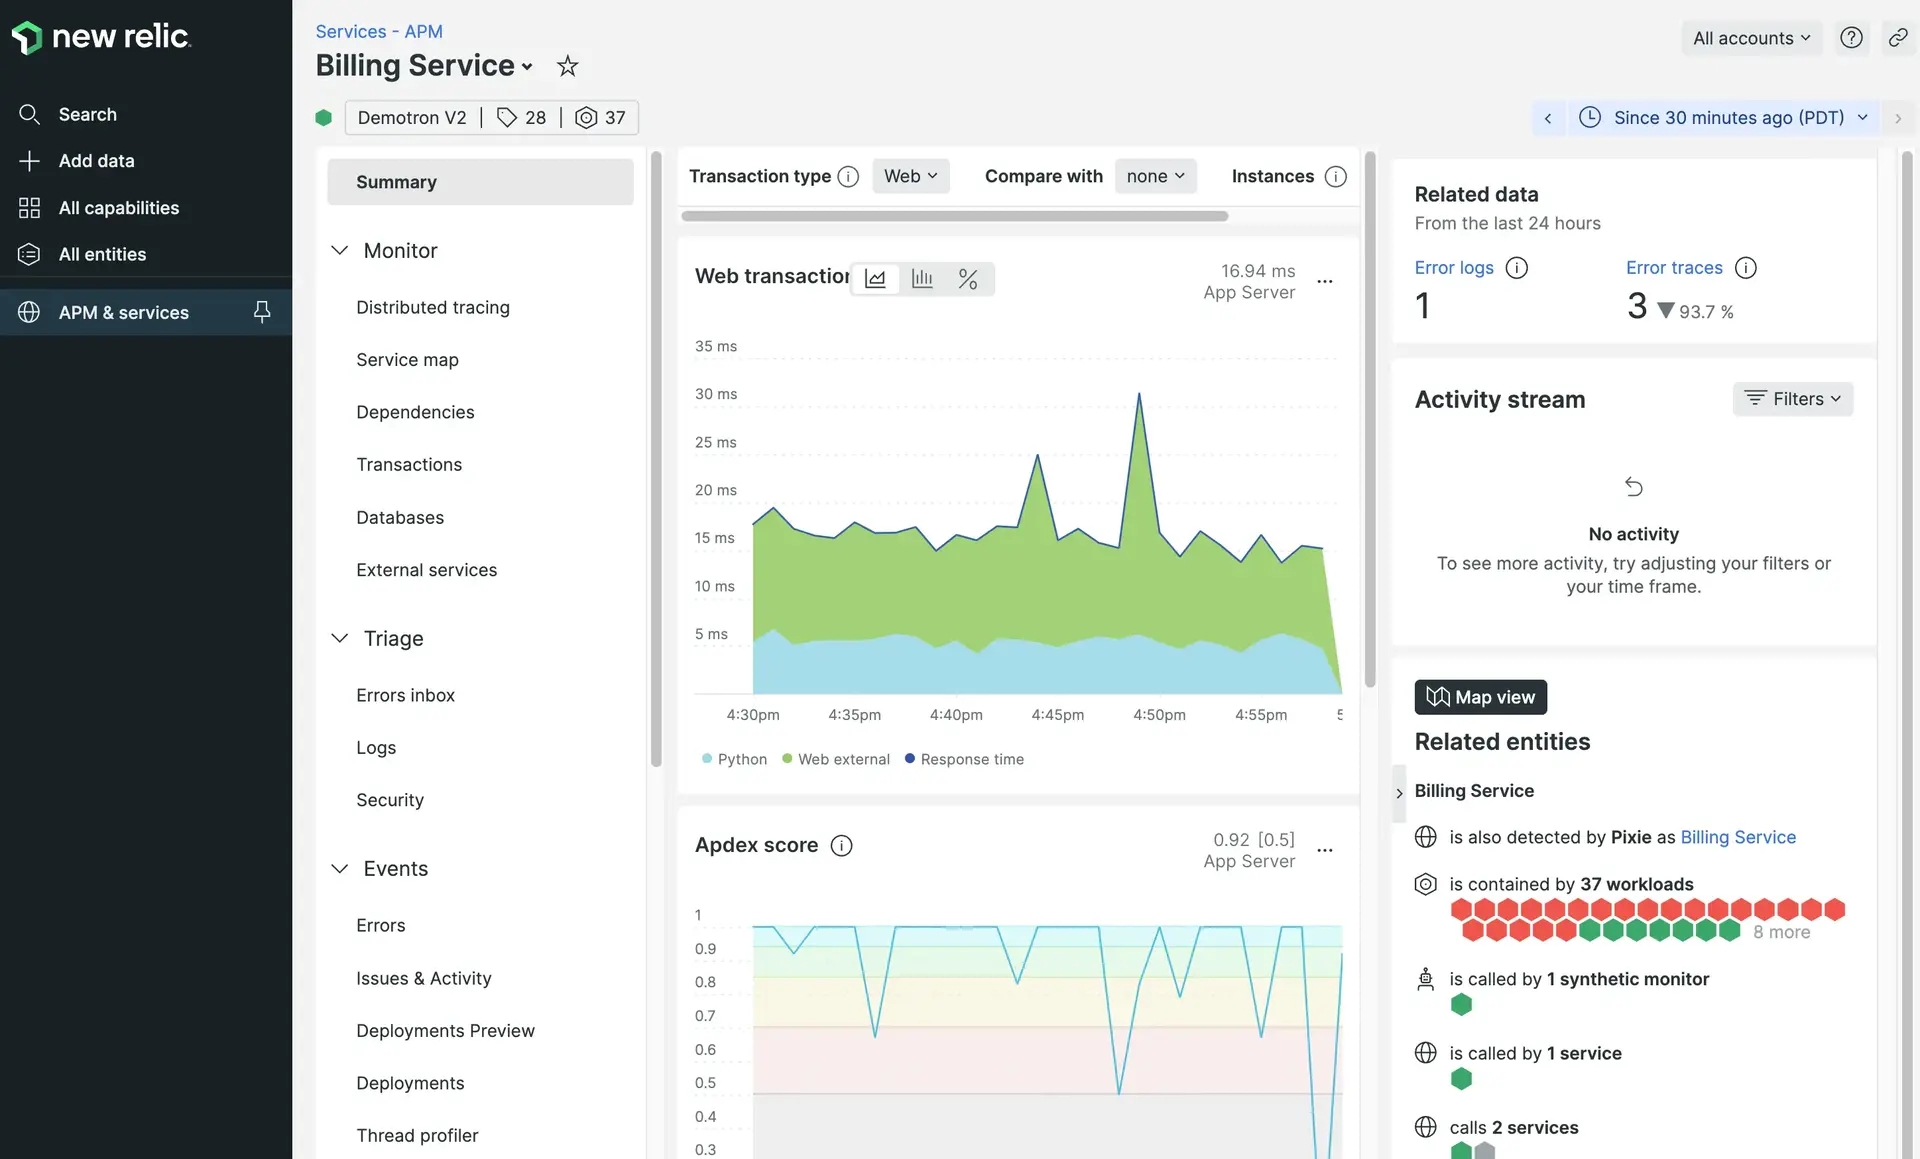
A screenshot of example .NET APM dashboards

Installation options

The New Relic .NET agent has installation options for Linux, Windows, AWS elastic beanstalk, WCF, Nuget, and Azure cloud, web, and service fabric. Select your installation path using the form below for installation instructions based on your environment!

Tell us about your .NET app

Remove existing monitors

Before installing the .NET agent, ensure that you have disabled any other monitoring agents you have to prevent interferance with .NET agent reporting.

Optional: Guided install

Our guided install is an option available for:

  • Windows .NET apps on IIS
  • .NET Core applications on Linux

The guided install is a single CLI command you can run to monitor your .NET apps and your infrastructure components. It's a good option for small organizations, or for anyone who wants to test out New Relic.

For a more permanent and scalable solution, we recommend the standard manual install of the agent: keep reading for how to do that.

Download the agent

To download the agent:

  1. Ensure you have admin rights for your Windows admin group. For more on this, see the docs on permissions.
  2. Download the installer that matches your system architecture:

Install the agent

  1. Run the install wizard. Some tips for using the install wizard:

    • You'll need your New Relic license key.
    • For IIS only: If you'll be monitoring only apps hosted on IIS, leave Instrument all unselected.
    • If you're updating an existing installation using the install wizard, select the Change option.
    • Optional: you can also run the installer via the command line or from a script. For how to do that, see the advanced install details below.
  2. For each application you wish to monitor, give it a meaningful name. For tips on that, see Name your app.

  3. If your application is short-lived and exists for less than 60 seconds, it requires configuration or it won't report data.

  4. Restart affected applications. If using IIS, restart that.

Enable the agent (optional)

For self-hosted WCF applications (hosted as a custom Windows Service, a console app, or a Windows Forms app), you must explicitly enable the agent for your application(s). Here are instructions for .NET Framework and .NET Core:

Enable the agent for your application with one of the following methods:

For .NET Core, you must configure your application to be monitored by setting the following environment variable:

CORECLR_ENABLE_PROFILING=1

We recommend setting the environment variables for each application you want to instrument. If you set them globally, you might instrument .NET processes other than your apps.

For details on setting environment variables per process instead of system-wide, see this Support Forum forum post on setting variables.

.NET Core and custom instrumentation [#custom-instrumentation]

ASP.NET Core apps are automatically instrumented, but for other .NET Core frameworks, you must custom instrument your app. For how to do that, see Custom instrumentation.

Enable for WCF

Enable or disable ASP.NET compatibility mode in your WCF application depending on which type of events you want monitored:

If your application is receiving traffic, data should appear within a few minutes. If it doesn't, see No data appears.

Did this doc help with your installation?

What's next?


Look for your app data in the UI

Look for your app data on the APM Summary page (it can take a few minutes).

Read the APM docs

For example, read about the Summary page, the Errors page, and the Transactions page.

Still not seeing data?

Follow our troubleshooting steps.