Objectives
By the end of this tutorial, you will:
- Understand how to use the external services UI
- Identify any slow external services such as API calls
- Review transaction-level performance

Why look at external services
The external services feature allows you to observe the upstream and downstream activity of a service. Those upstream or downstream external services may be your own services you instrumented or third-party services and API calls. When these external services have a slow response time, they hold your app up causing slowness.
Identify slow external services
Let's take a look at how to identify slow external services:
Navigate to the external services UI: Go to one.newrelic.com > (select an app) > Monitor > External services. Toggle Show new view in the top left if not already enabled and then click Map in the top right.
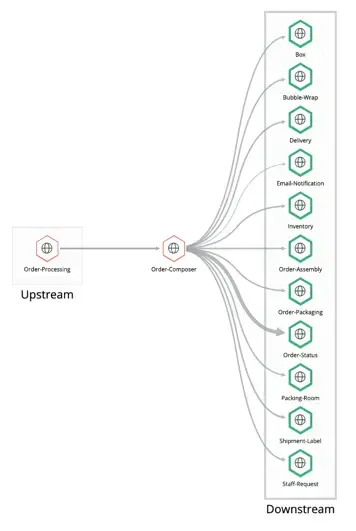
Your application’s dependencies, also known as upstream dependencies, are listed on the left. On the right are services that depend on your application, known as downstream services. You can see which services are healthy as well as the throughput and time consumption for each service. You can select a service to see more detailed information on that service.
Hover over all your upstream dependencies, and try to identify any that have a high response time or trace count. Pay specific attention to any that have signifigant spikes in their recent history. If you find a suspicous service, drill in deeper by hovering over it and selecting the View traces button. This new pane displays information about that transactions trace, which records the available function calls, database calls, and external calls of that transaction.
There are various ways to use the information provided by this page, so feel free to explore. Here's an example workflow:
Look for the thickest and darkest line on the map and follow it to its upstream or downstream service.
Click on the upstream or downstream vertex.
View a breakdown of transactions between the two services.

In this example, one of the thicker edges (lines) goes from the Order-Composer service to the warehouse endpoint in the Order Status service. If you decide that a particular transaction is taking the most time, click on that transaction to focus specifically on its dependencies.

In this drill-down view, you can see the transaction between the Order-Composer service and the warehouse endpoint in the Order-Status service. From any point in this flow, consult the supporting performance charts, which show changes over time.
If you reach a point in the drill-down where you want to see distributed tracing, click List in the upper right, and then click Traces in the table.

Tip
Service maps, like the one used above, are a powerful in understanding the complex relationships within your system. The more services you have instrumented, the more observability into your system you unlock. Learn more about service maps.
The map view in the previous steps is great for a visual view of your system, but if you're struggling to identify your problematic external service the list view might be more helpful by providing data in graphs and tables.
First navigate to the list view by selecting List in the top right. This page shows various tables and graphs you can use to identify slow external services. You'll use this page to triage your services:
Take a look at the Response time graph. This shows your five slowest external services. Take note that while these are your slowest, they are only slow relative to the rest of your services. They might not be slow enough to cause disruption to your app.
Take a look at the Traced error count. Are there are a large amount of errors? If so, what service are they coming from?
In the bottom table, sort the services by % change. This will show your services ranked by how much their duration or traces called have changed recently. Are there any services that have a drastic uptick recently?
Drill deeper into any services identified above by selecting View traces next to that services name in the bottom table. Use this information to replace those services, optimize API calls, or distribute loads across your your services
Check your work
You’ve scoped out the problem, now time to identify a solution. Your fix will be specific to your issue, but here are a few examples:
- You realize you're calling an API twice on accident. Remove the duplicate call to half your total response time.
- A specific API call starts to throttle each day around noon, and you realize you reach the free limits of the API at that time each day. Find an alternative API or upgrade your access.
- Under heavy load, you hit another internal service beyond it's limits resulting in slow response time. Distribute this load across more services or find a way to reduce or optimize your load.
Push your fix to development, then run a typical load test to get a sense for how your app will run in production.
As you monitor your external services, keep a close eye on your charts:
- Are your external services hitting an acceptable response time? You're done!
- Did they improve? Use what you've learned to figure out why they improved beyond normal.
- Are you still seeing slow response times? Maybe there's a database problem, or maybe your transactions are running slowly: