Your app is slow. Perhaps it's so slow it's causing downtime or issues in related services, or perhaps it's simply a slow back-end response that makes your UX just a little bit worse. What do you do about it?
This tutorial walks you through how to use New Relic to triage your application and identify the root cause of your app's degraded performance. You'll start by "instrumenting" your app with an agent, which means installing a piece of code that reports data about your app to New Relic through language and framework specific integrations. Using this data in New Relic, you'll dig into the performance of your application and identify slow transactions, slow database queries, or slow external services as your issue—or possibly all three!
How to fix a slow running application with New Relic
Addressing a slow running application requires a systematic approach to identify the root cause of performance issues. The following steps will provide you the information needed to troubleshoot, diagnose, and resolve issues negatively impacting the speed of your application.
Implement performance monitoring through application instrumentation
Before you can improve your site's performance, you need the ability to see what's going on. New Relic monitoring always starts with an integration, or a piece of code that collects data from a relevant technology and reports it to New Relic. To monitor your application's performance, you will use an agent created specifically for your app's language.
Click a logo to install an agent. This will send you to the New Relic platform where you will be guided through installing and configuring the agent.
Once you've installed an agent, go to one.newrelic.com and select your app. If you don't see much data just yet, step away for a while and let the agent gather real-time data as your application runs.
Identify application issues
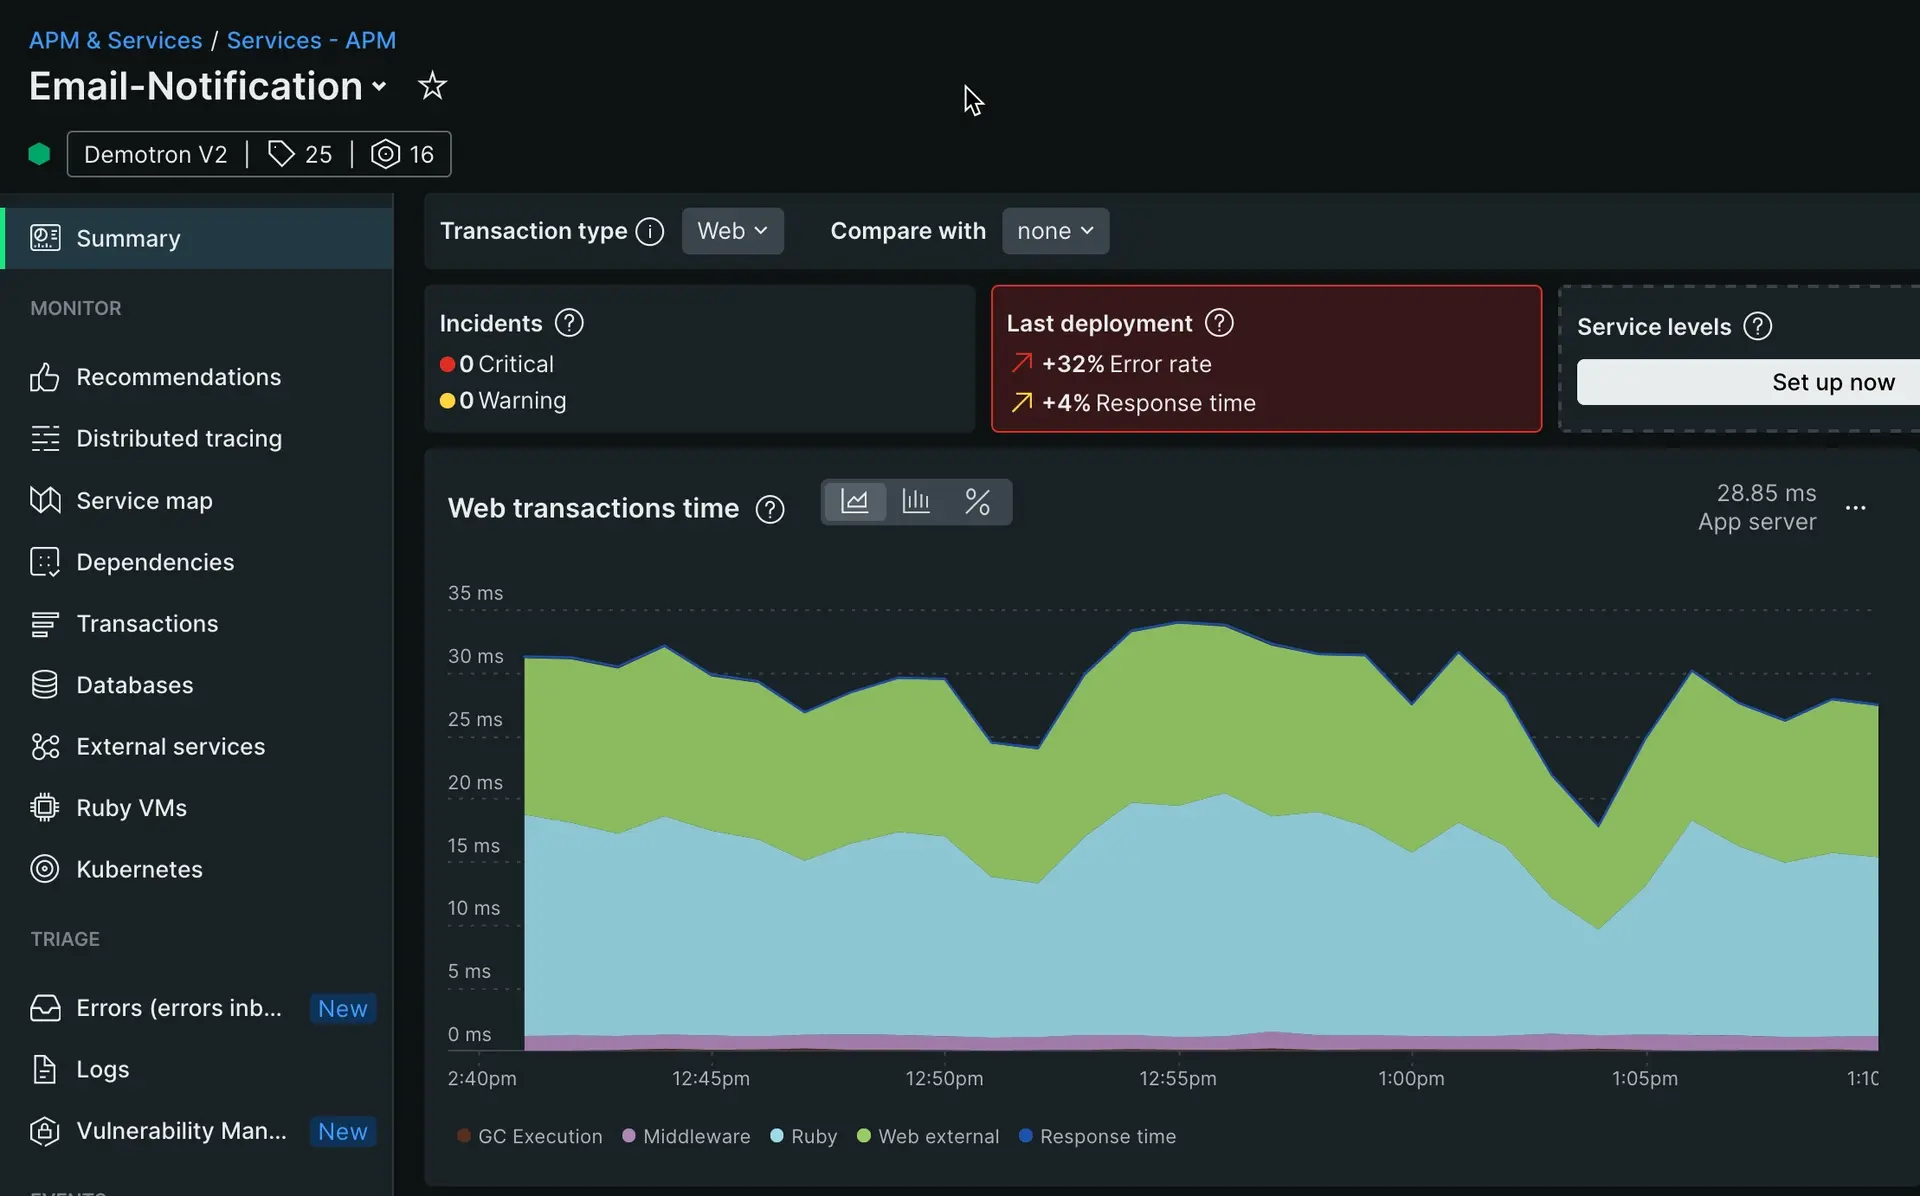
Look at the Web transactions time chart. This chart displays the average response time of certain metrics within your app. As your chart populates with data, take note of strange spikes in any line or segment. At the same time, take note of any segments or lines that consistantly take a large amount of time.
Tip
Use the time picker in the top right of your page to look for spikes over various time ranges.
Diagnose your application
With the information on the charts provided you can analyze the current speed and efficiency of your application transactions, database queries, and external services. The next step is to prioritize and implemented targeted fixes to improve performance.
Choose your next step in this tutorial based on which colors take up the largest chunks of the chart, or show spikes or other odd behavior:
If it's the blue line: slow application traces
The blue line is application code, specifically time spent in your application on code that isn't external or database calls. To troubleshoot this, click here for tutorial step 2.
If it's the yellow segment: slow database queries
The yellow segment is database queries, specifically time spent calling and waiting on database queries. To troubleshoot this, click here for tutorial step 3.
If it's the green segment: slow external services
The green segment is external services, specifically time spent calling a HTTP service or endpoint. This could be a HTTP endpoint as part of the same app, another service as part of the same system, or it could be a completely external third party API. To troubleshoot this, click here for tutorial step 4.
