Service map is a visual representations of your entire architecture from front-end to back-end, providing a comprehensive overview of the interconnected components that make up your system. This map dynamically displays the relationships between your applications, databases, hosts, servers, and out-of-process services (called web externals).
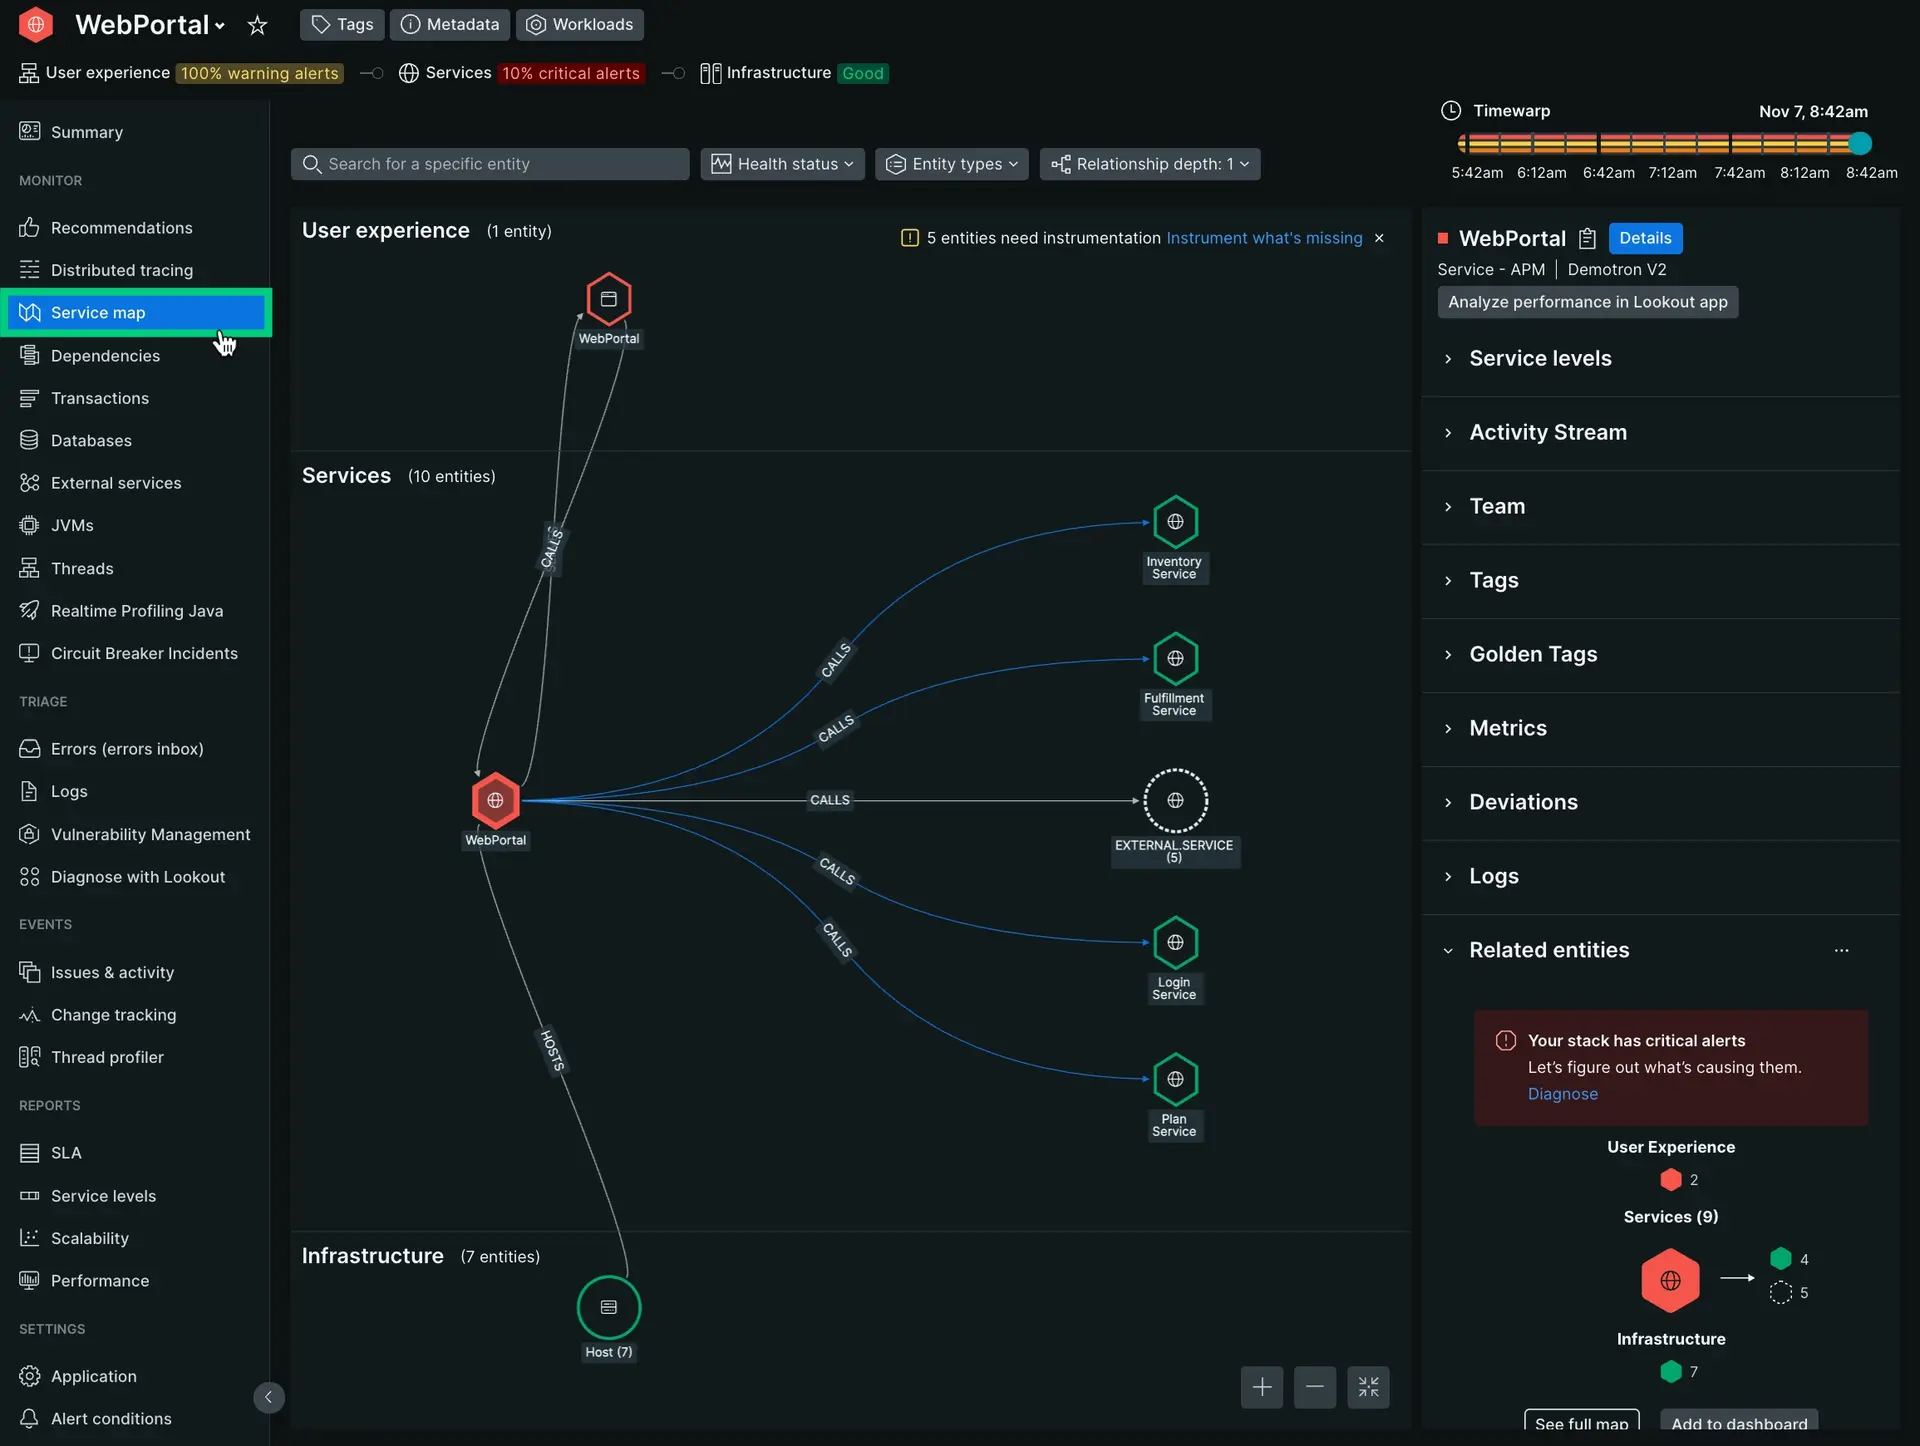
one.newrelic.com > All capabilities > APM > (choose an entity) > Service map: Service map shows your dependencies and how they're performing.
Use service map
Service map works with distributed tracing to connect relationships between entities. Service map is still functional if you haven't enabled distributed tracing, but we recommend having distributed tracing enabled for all agents. This ensures a more consistent experience while using service maps.
To access service map:
- Go to one.newrelic.com, then select either APM & services, Mobile, or Browser.
- Select an entity.
- On the left-hand side, click Service map.
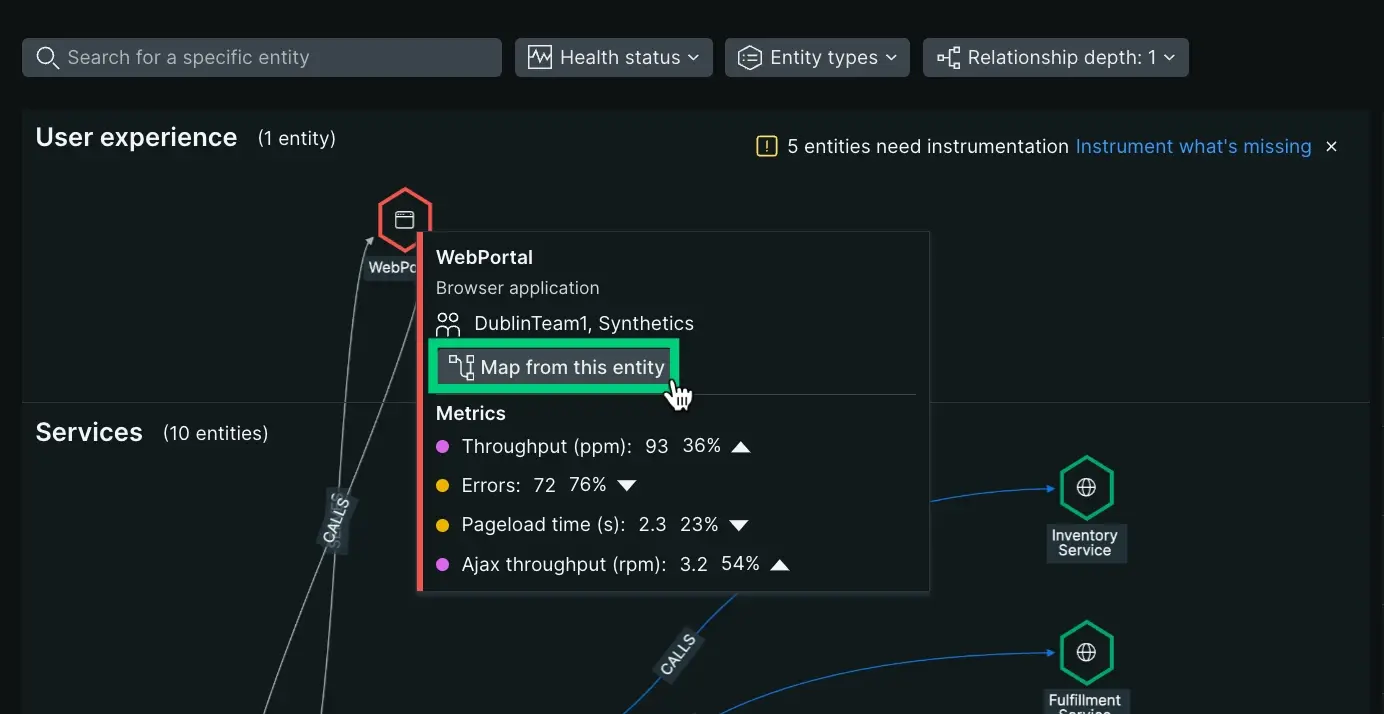
Map from a specific entity
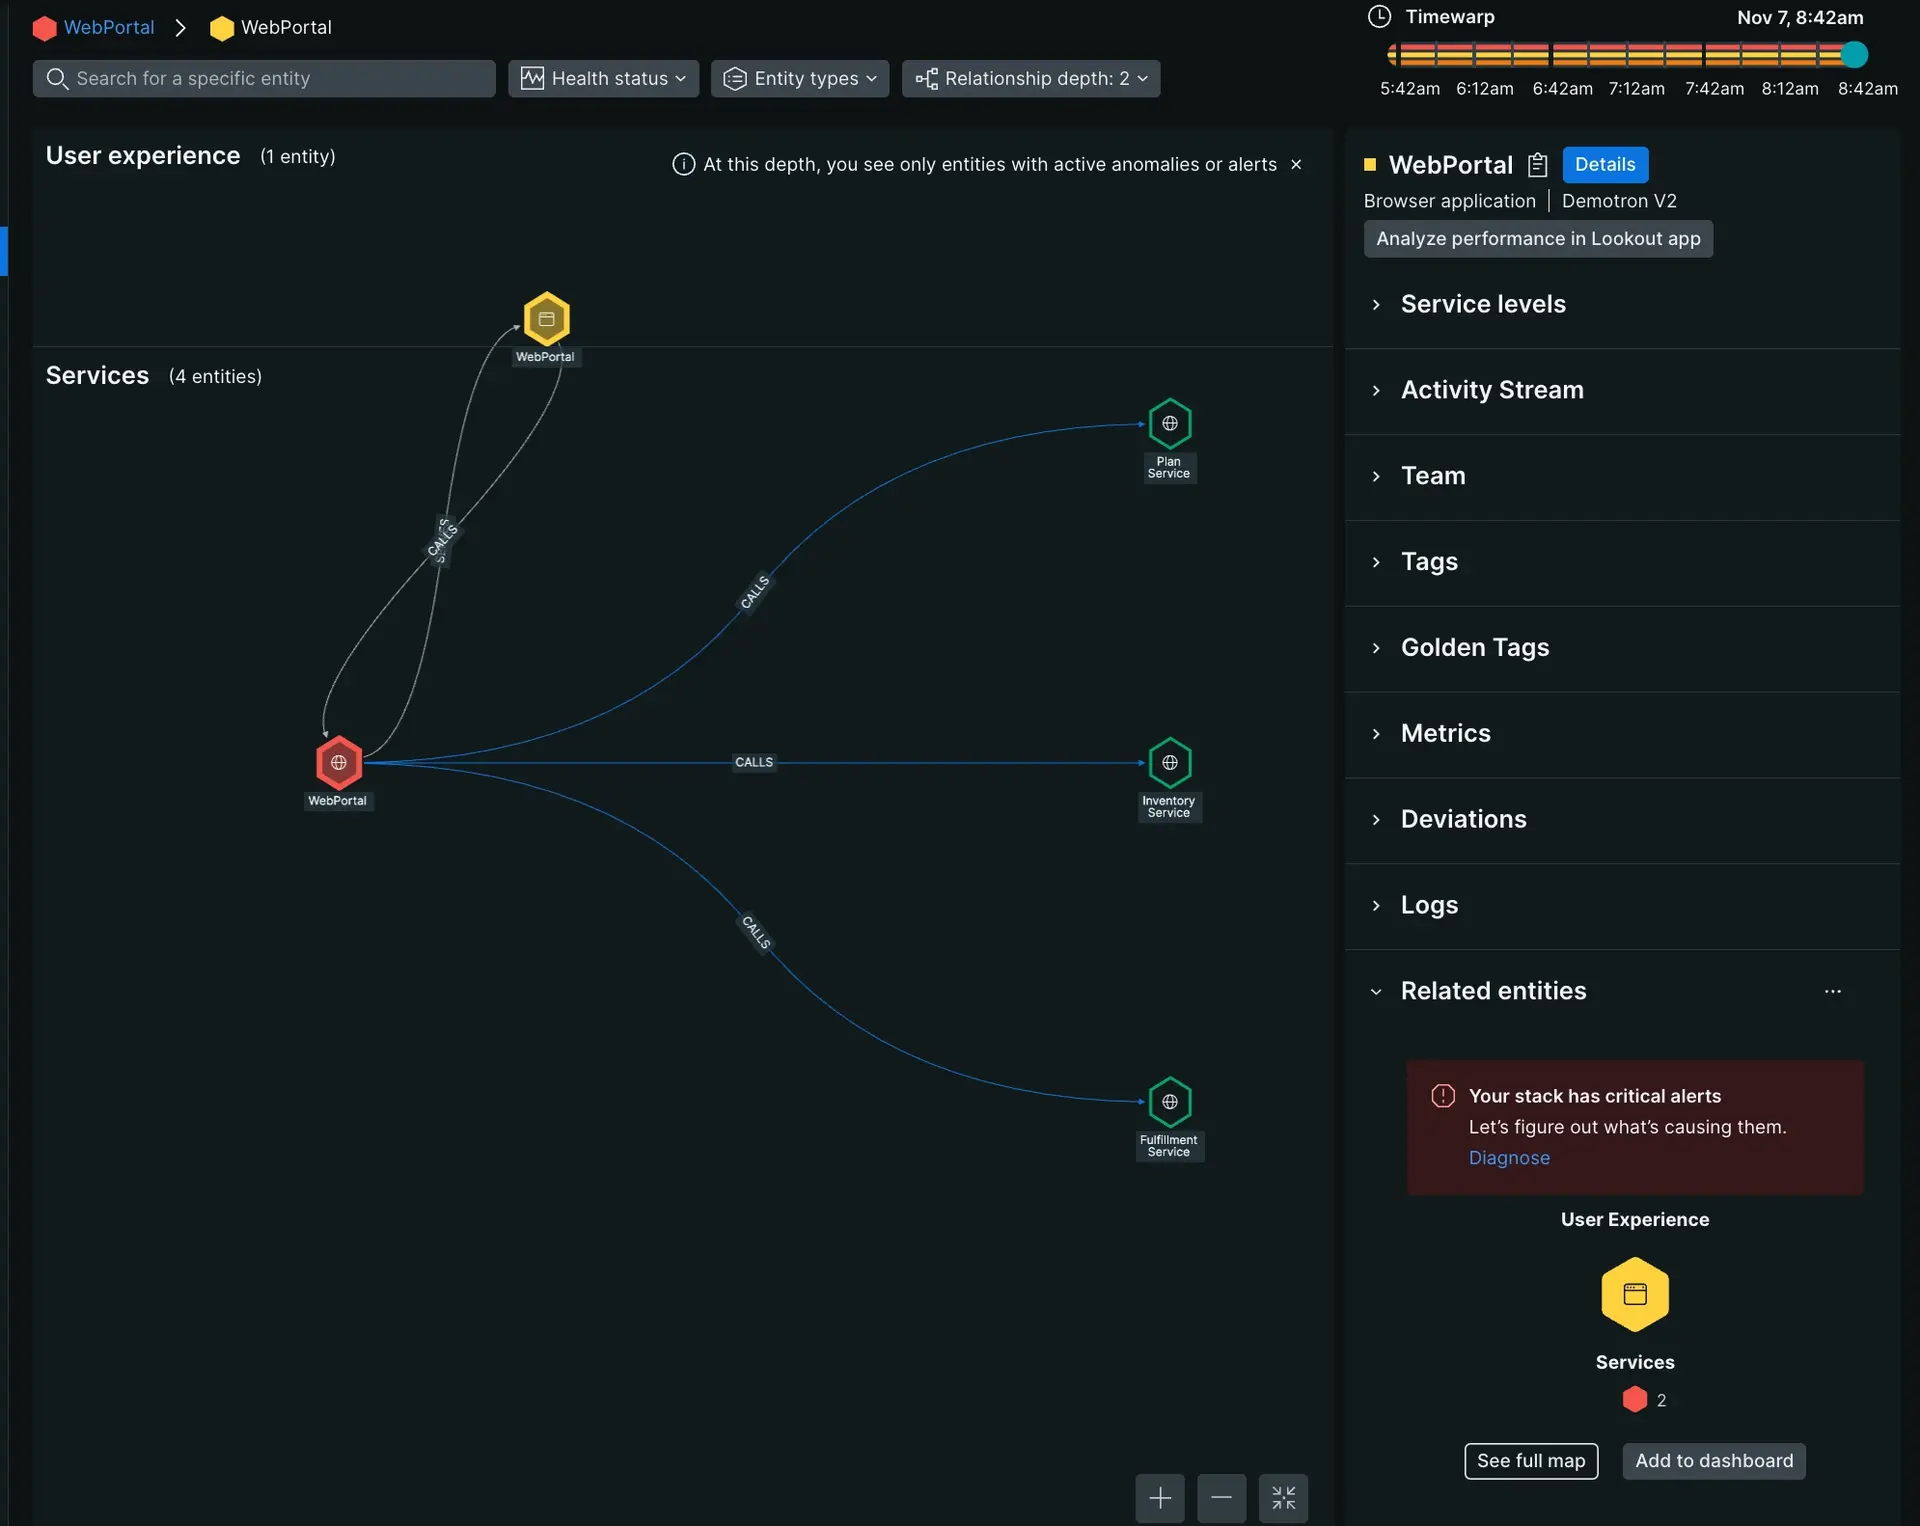
Hover your cursor over an entity and click Map from this entity to view how entities are related from that entity's perspective. The service map will update accordingly.
Filter entities
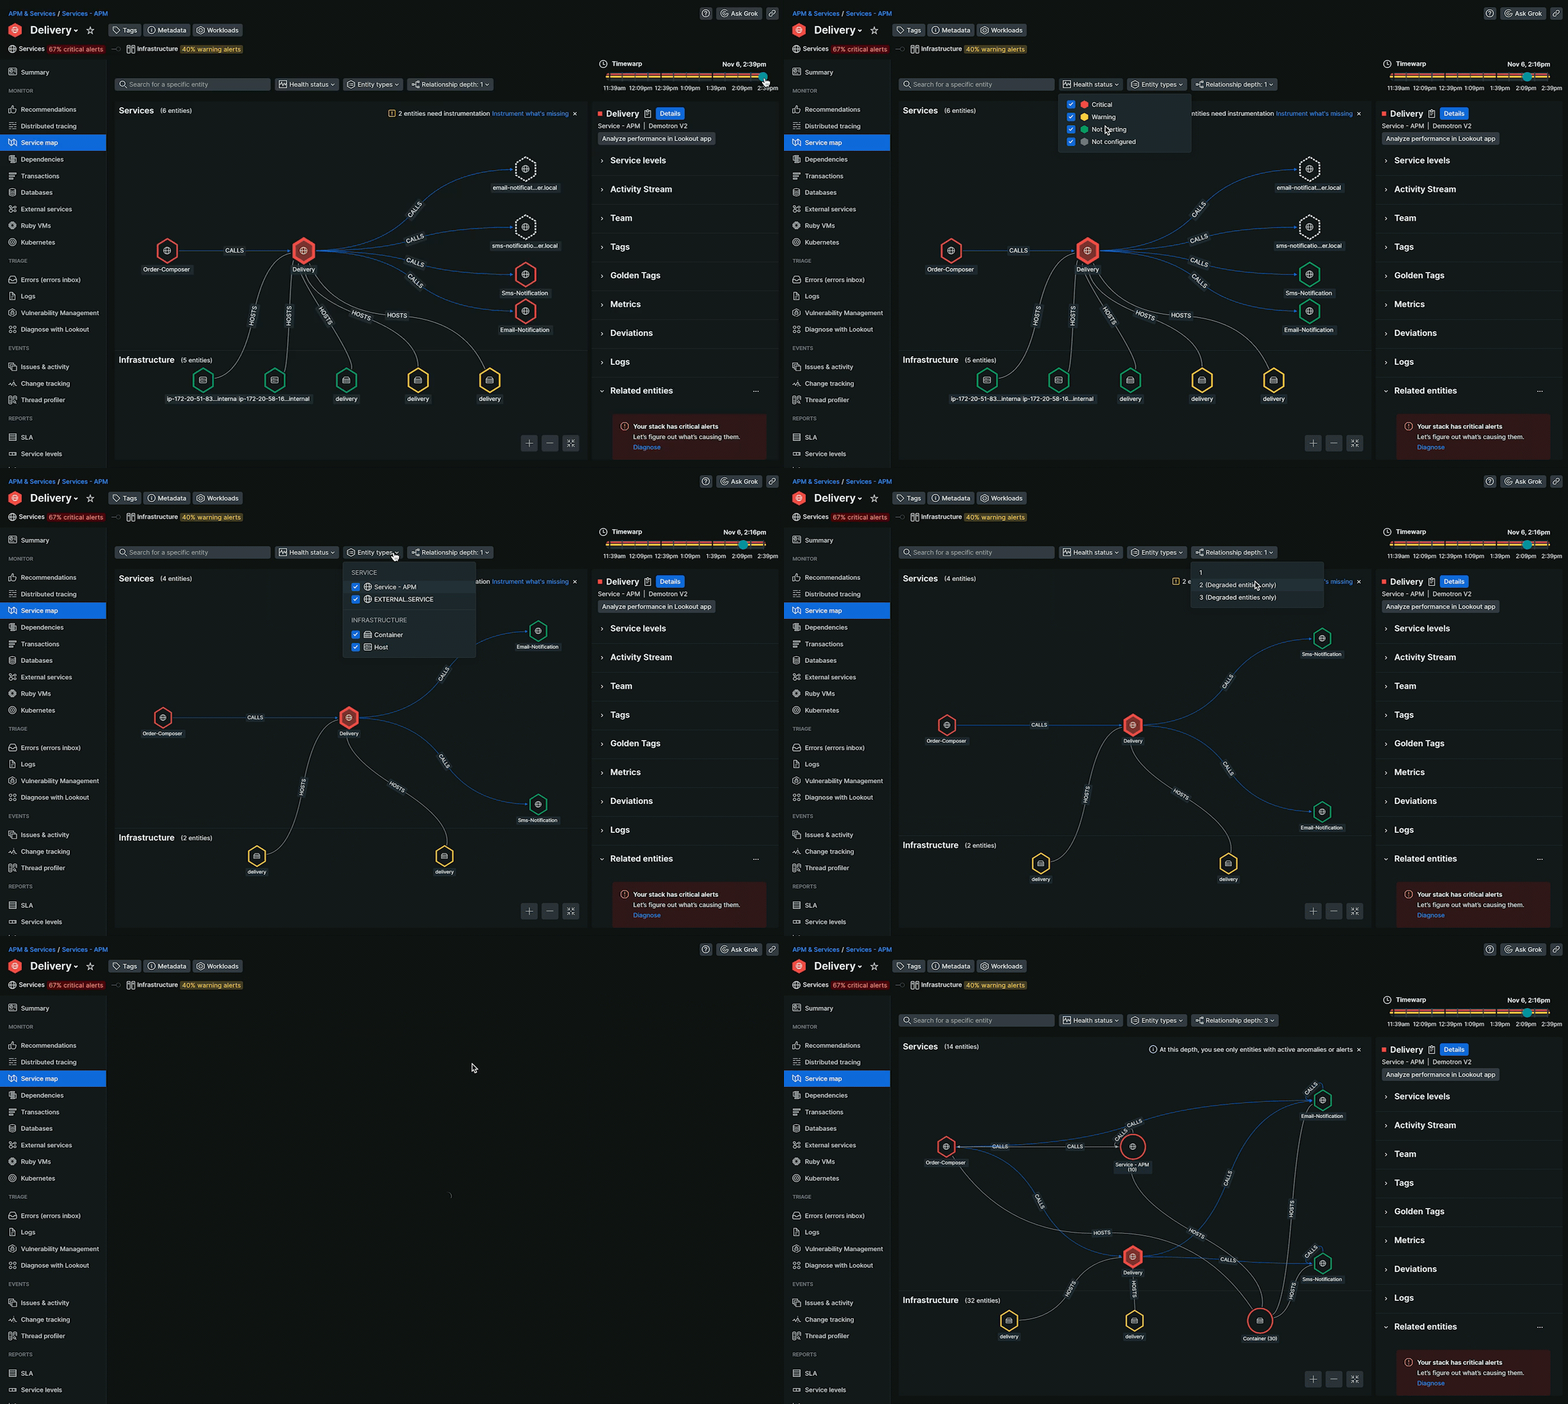
You can filter the service map based:
Health status: Remove the health status color around affected entities.
Entity types: Hide specific entities from the map.
Timewarp: Explore how entity health changed in the last three hours.
Relationship depth:
- Depth 1: (Default) Displays all entities directly connected to the main entity, regardless of their health status.
- Depth 2: Focuses on degraded entities (with alerts) that are two hops away from the main entity. Entities with direct connections to the main entity are not included in this view.
- Depth 3: Similar to depth 2, depth 3 concentrates on degraded entities with alerts but extends the search to entities that are three hops away from the main entity. Direct connections to the main entity remain excluded.
Tip
The purpose of limiting the display of entities to degraded ones in depths 2 and 3 is to prevent the service map from becoming cluttered and overwhelming. As you increase the relationship depth, you are going further into the network of entities, but you are only seeing entities that are experiencing issues. This can help you to focus on the most critical problems in your system.
View entity performance metrics
The right-hand pane contains in-depth data about all entity performance.
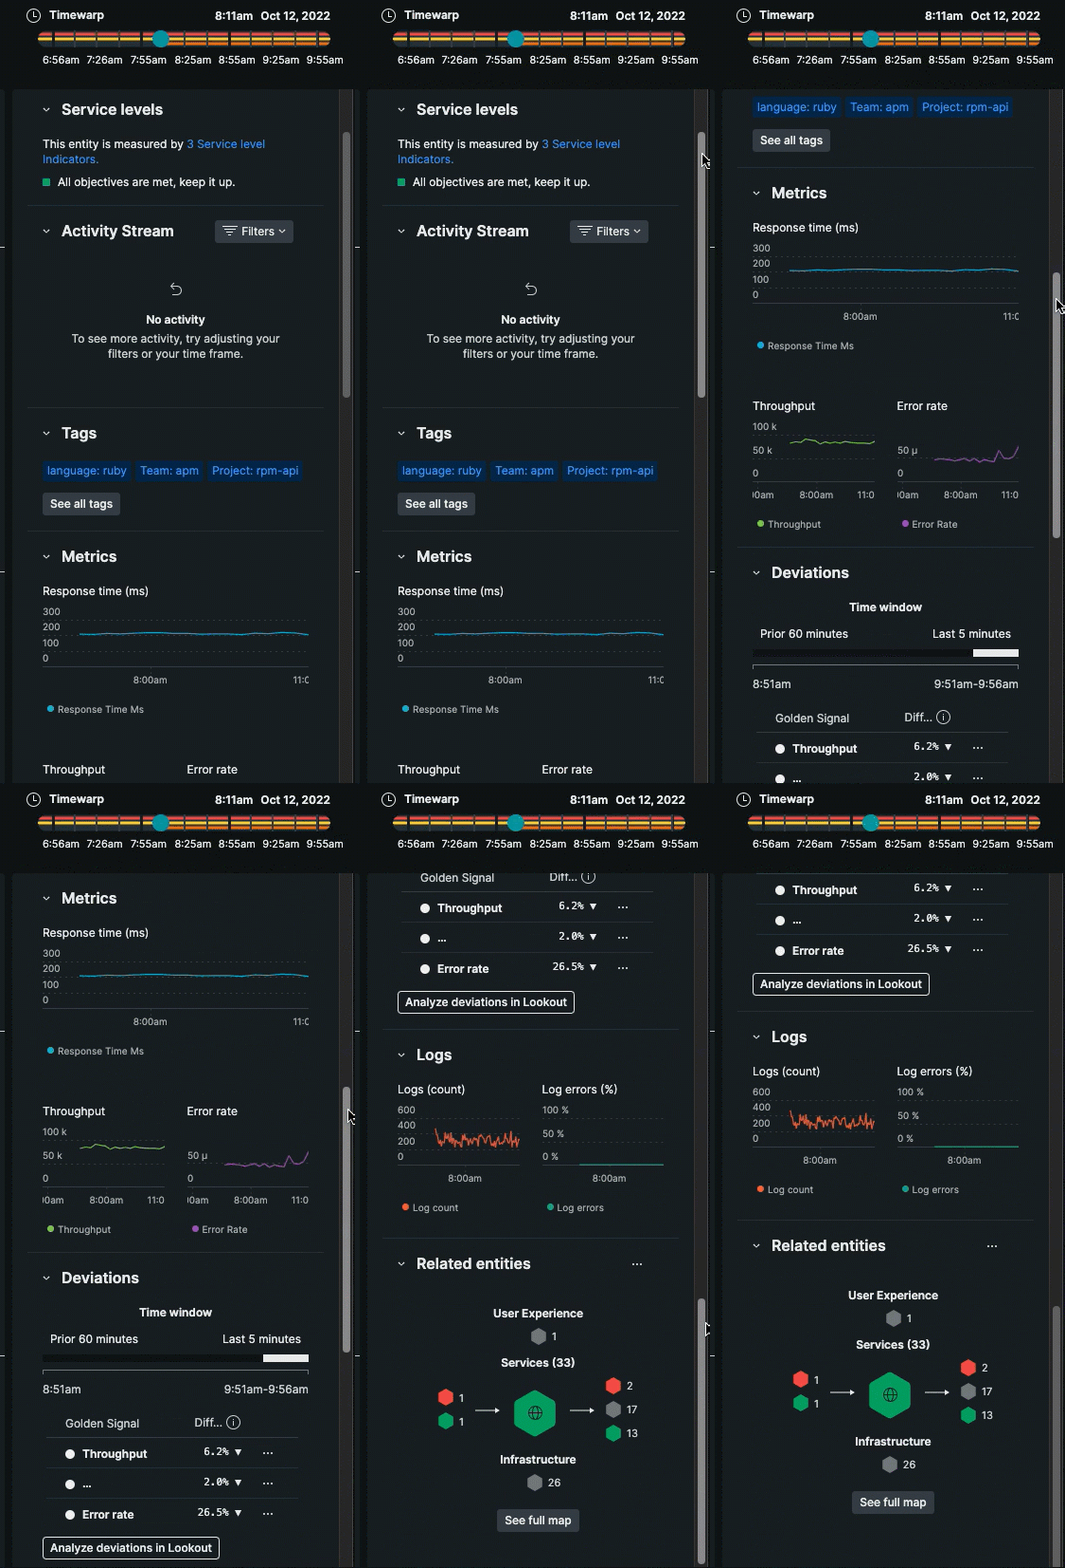
Taken together, maps help you find the exact moment and place an incident appeared in your system.
Explore service relationships with GraphQL APIs
You can discover the same relationship connections available in service maps with in our NerdGraph explorer, a tool to run GraphQL queries and mutations. To get started, see NerdGraph tutorial: View entity data.
Troubleshoot
If you are unable to view certain entities in service maps, see Missing or obfuscated data.
If you have uninstrumented entites, see Uninstrumented entities in service maps.
About externals and databases in maps
In the New Relic UI, your out-of-process services are referred to as web external or background external data. Externals and databases have slightly different features in service maps than other entity types:
- Unlike other entities that appear in service maps, externals are aggregates. Clicking on an external service in the map shows you the list of all the external services that are rolled up into the one external entity. This is to reduce map clutter, as some entities can have dozens of externals being reported.
- Due to their agentless nature, databases cannot have alerts set for them; only service calls made to the database are reported to New Relic.
New Maps experience
While the existing service map offers valuable insights, it has certain limitations:
- Fragmented experience: Navigation across different views can lead to fragmented insights.
- Incomplete map: Limited ability to explore the entire cloud estate.
- Inconsistency: Discrepancies in data and interfaces across different maps.
- Information overload: Excessive data presentation can overwhelm users.
- Missing entities and relationships: Lack of automatic discovery of services and cloud resources.
To address these limitations, we have New Maps experience, which brings enhanced capabilities and a unified map experience. Learn more about New Maps experience.