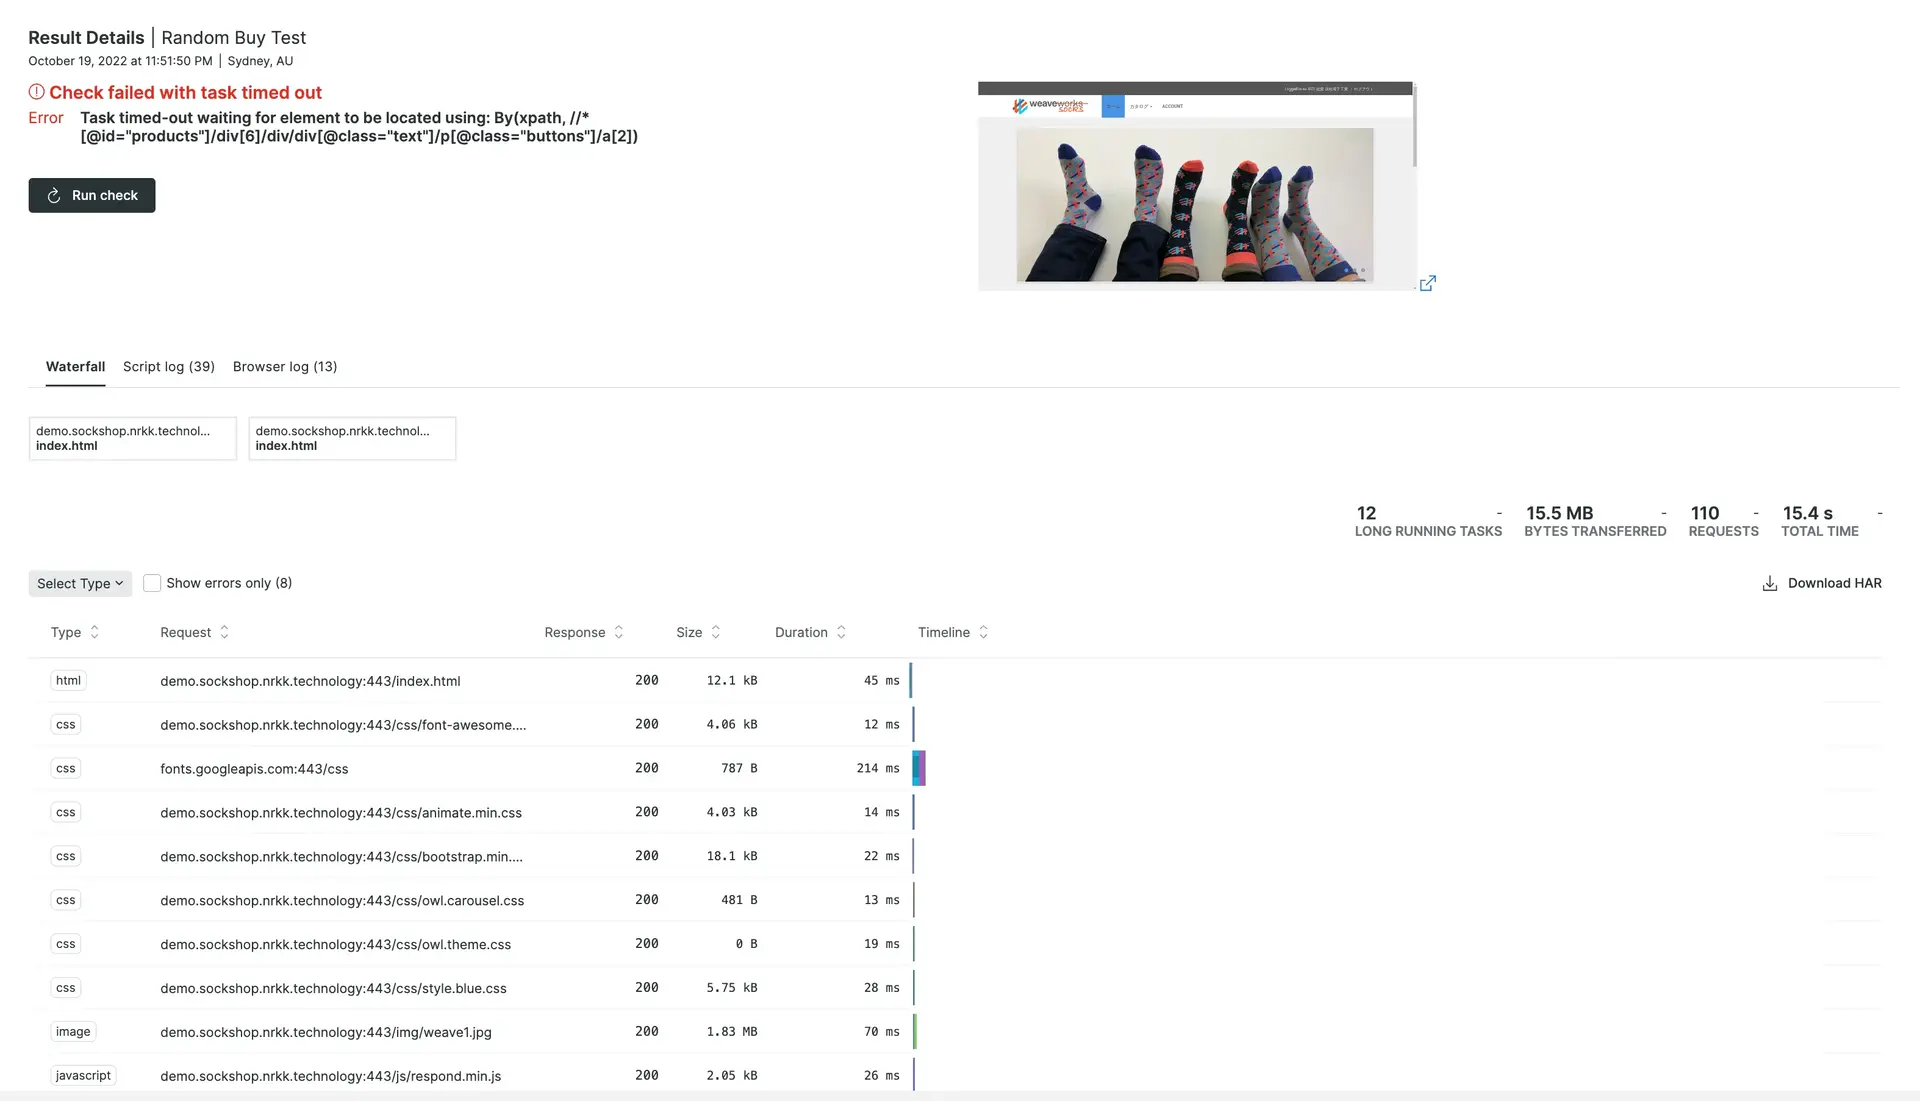
Synthetic monitoring automatically records each simple and scripted browser monitor check, allowing you to see the load time and response size for every run, as well as the exact order in which each resource loaded.
Use the Results page and the selected monitor's details page to:
- Select a resource to view load timing, response and request headers, and other details.
- Use these details to find problems and diagnose performance issues.
- Run rechecks to verify a single failing location or result when needed.
Tip
For information on ping monitors, see View ping monitor results.
View results
To access a complete list of simple and scripted monitor results from the Results page:
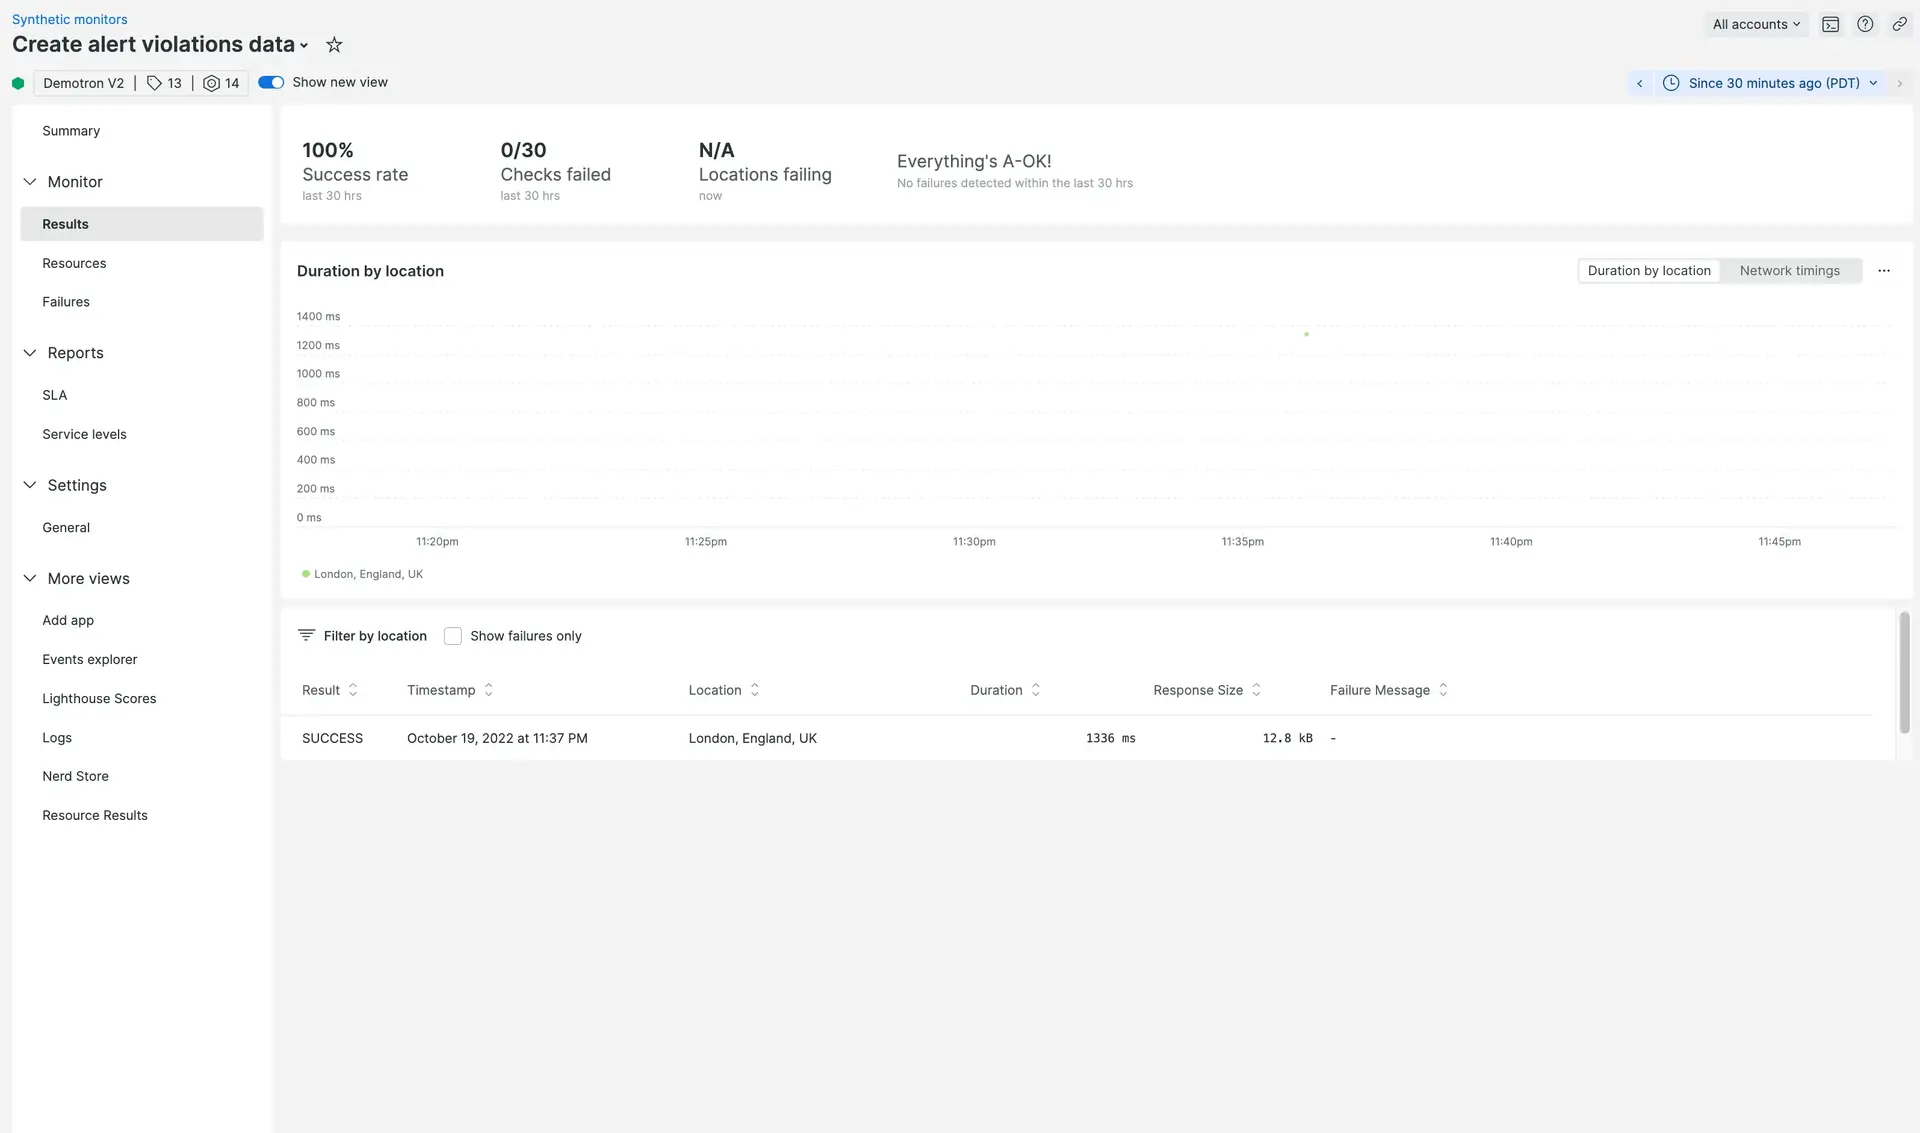
- Go to one.newrelic.com > Synthetic monitoring > (select a monitor) > Results.
- To find the type of result you're looking for, sort the list and filter by location. For example, to locate an unusually fast response time from Ireland, sort by Duration (asc) and disable all locations except Ireland, EU.
- To understand how your website performed at a specific moment in time, including details of load time and response size, use the Results page's detail view.

one.newrelic.com > Synthetic monitoring > (select a monitor) > Results > (select a result: View details of each monitor check, including load time and total load size.
You can also access interesting results for your simple and scripted monitors directly from the Overview and Failures pages.
If you want to... | Do this... |
|---|---|
Get details about page resources | Use the timeline view. (For API test monitors, there may be only one page resource.) From the timeline view, you can:
|
Verify a single failing location or result | Select the monitor, then click Run check. |
View script logs
Scripted browser and API tests often generate script logs, which provide valuable insights into how your script executes. These logs include the contents of the selected script along with any custom logging messages you've added.
Here's how to view script logs:
- Navigate to Synthetic Monitoring > Results.
- Select a specific test result.
- Click on the Script Log tab.
Tip
Script logs are only available for tests that have failed or where the user has opted to include custom logging.
If you want to manually record script milestones, you can include logging functions in your script.
View monitor screenshots
Simple browser and scripted browser monitors can take screenshots. By default, both simple browser and scripted browser monitors take screenshots only if a check fails. However, scripted browser monitors can take a screenshot on every check if you manually call take screenshot in your script.
Tip
Keep in mind that scripted browser monitors only save the last screenshot taken.

one.newrelic.com > Synthetic monitoring > (select a monitor) > Results > (select a result).
Timing details
For some monitor types, the overall monitor check duration will be larger than the individual page request durations. This is because some browser behaviors are not measured individually but still count towards the total check time.
Examples of unmeasured behaviors include:
- JavaScript interactions
- Resource prefetching and prioritization
- DNS pre-resolve
- TCP pre-connect
- Page pre-rendering