Support for metric timeslice data
APM metrics are reported as timeslice data. You can now leverage timeslice data in your SLI queries.
Learn how you can configure SLIs and SLOs in our docs.
Support for dimensional metrics
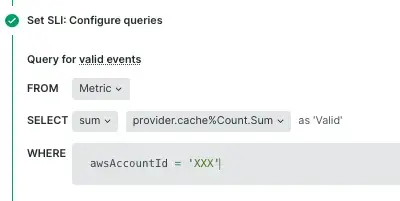
New Relic service levels is now supporting dimensional metrics as a data source for SLIs.
As well as access to dimensional metrics, you can now also query your data using the aggregation function sum().

Learn how you can configure SLIs and SLOs in our docs.
New service levels details page
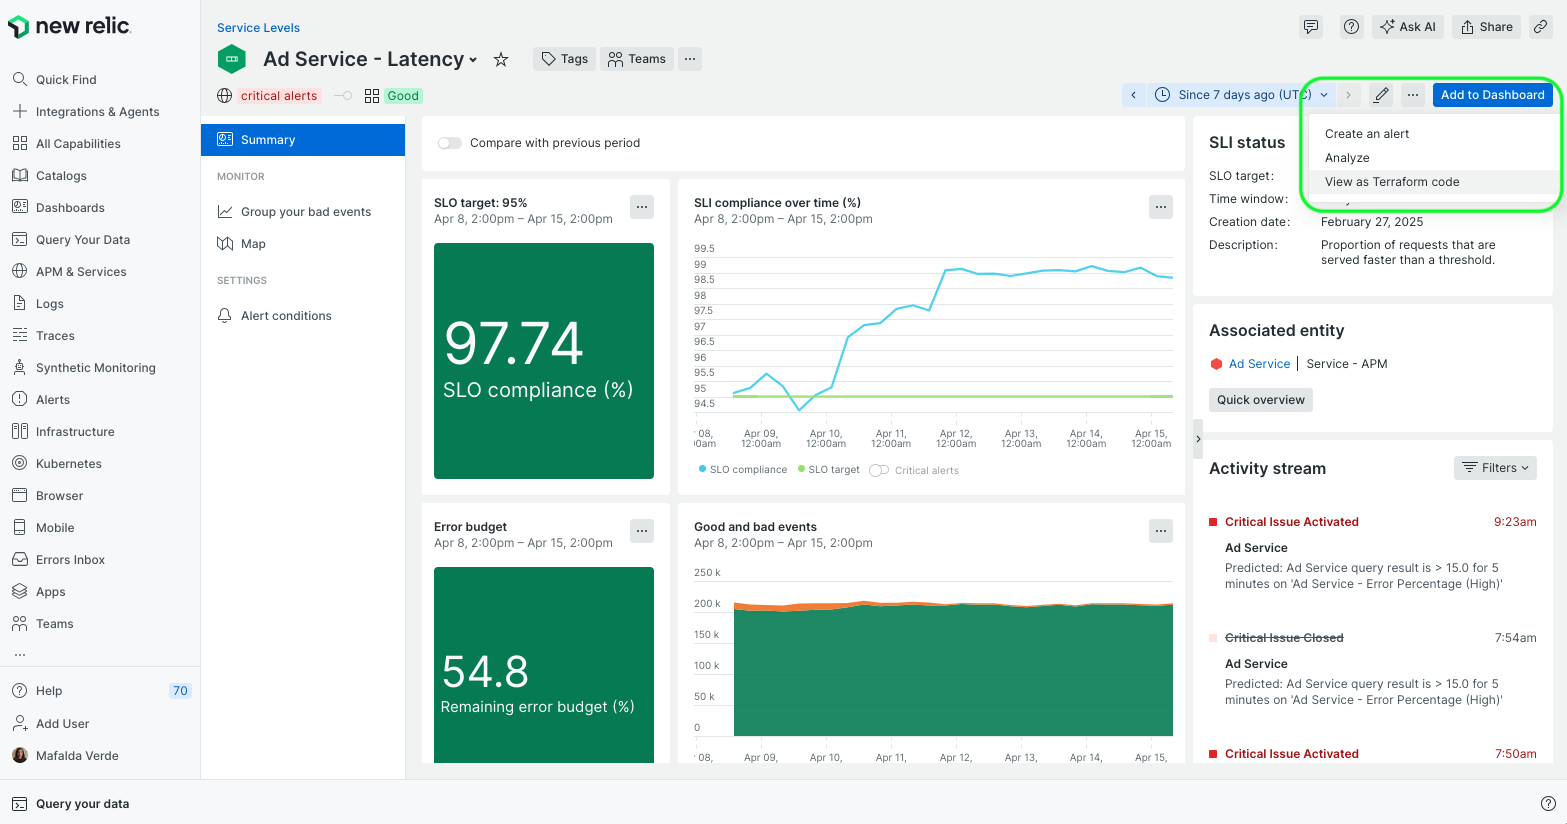
We've redesigned the service levels details page view to better help you with the root analysis of an SLO breach.
What we have introduced:
Activity stream - The activity stream, streams recent events from alerts and deployments and provides a direct view into what has changed in your system so that you can fix outages quickly.
Alerts - Create alerts on error budget fast-burn rate.
Analyse - Easy access to the original SLI query to enable further analysis.
Compare with - Compare the SLI attainment across two different time frames.
Related entity - A link to the SLI related entity's mini-overview, which provides important metrics of that entity.
Save as a dashboard - Share the service level data by creating a new dashboard.
Time picker - Drag across a section of a chart to zoom in on that time range. Or, if you want to select a pre-set time range or use a custom one, use the time picker in the top right corner of the UI.

New Relic service levels is now generally available to all full platform users.
We've redesigned the service levels views to better help you in your day-to-day:
- Use the operations view to see your compliance and error budget trends.
- Use the period over period view in your plannings and business reviews.
Now, you can also add tags to your service levels on the setup flow, so you can later filter and group them by owner, user journey, maturity level, or your own custom tags.
Learn how to get started with service levels. Need more help or have feedback? Contact support!
New Relic suggests some typical SLIs for APM services and browser applications. If you choose to create one of the suggested SLIs through the UI, New Relic will analyze the latest data available, and will calculate the baseline for your SLI and SLO parameters.
One of the typical SLIs checks the proportion of requests that are served without errors. When we launched the service levels beta release we decided to name this SLI availability; but this term has generated some confusion because it is often interpreted as a service being up and running and able to receive requests. This is why we're renaming the suggested SLI as success from now on.
The existing SLIs created through New Relic suggested flows won't be renamed.
New Relic is introducing a breaking change on the service level setup flow: Starting on February 25, 2022, each service level indicator will support only one objective.
A little context
When we released the public beta back in December 2021, each SLI supported more than one SLO, which is a combination of target compliance and a time period. We thought that this flexibility could be useful in two different ways:
- Differentiate between realistic and aspirational targets: You'd set a single SLO period (for example, 1 week) and then a couple of targets. One target would represent the achievable compliance according to the current service baseline, while the other one would represent an aspirational compliance.
- Identify short term trends: You'd set a single target (for example, 99%), and then different periods to see how your compliance evolved. In particular, you'd probably report SLOs on a weekly or monthly basis, but you could use the daily SLO to see trends at a shorter term.
Although there's a third option (where you could have several SLOs with different combinations of periods and targets), we noticed it's not easy to manage and interpret in practice, so we're not focusing on this case.
On the other hand, while we allowed defining an SLI without an SLO, it wasn't very useful, so we're making it mandatory to define at least an SLO for each SLI now.
New SLI and SLO configuration
With this update, we'll provide the same functionality while sparing some configuration burden.
Before
- API: The
serviceLevelCreateandserviceLevelUpdatemutations accepted none, one, or more SLO targets and periods for each SLI. - Terraform: The
newrelic_service_levelTerraform resource accepted none, one, or more SLO targets and periods for each SLI. - UI: The setup flow accepted none, one, or more SLO targets and periods for each SLI. Service levels showed the compliance for the configured periods only.
After
- API: The
serviceLevelCreateandserviceLevelUpdatemutations require one (and only one!) SLO target and period for each SLI. Otherwise, it throws an error response. - Terraform: The
newrelic_service_levelTerraform resource requires one and (and only one!) SLO target and period for each SLI. Otherwise, it throws an error response. - UI: The setup flow requires one (and only one!) SLO target and period for each SLI. Service levels show the compliance for 1, 7 and 28 days, no matter the period you set for your SLO, simplifying the setup.
Migration
New Relic will execute an automatic migration to adapt the existing SLIs and SLOs to the new constraints:
- Those SLIs that had more than one SLO with the same target and different periods (for example, 99.0% for 7 days and 99% for 28 days) will keep just one SLO with the same target, adopting the longest period.
- Those SLIs that had different SLO targets will be split into different SLIs.
- The very few SLIs that didn't have any SLO configured will be assigned an SLO with a 95.0% target for a period of 7 days.
- SLIs with one SLO won't be modified.
Any charts that you've added to a dashboard will continue to work.
Important
Action needed! If you automated the creation of service levels through Terraform or Nerdgraph, you need to adapt your scripts to always define one SLO per SLI.
New
If you associate an SLI with an APM service or a browser app, we'll suggest some typical SLI and their queries. We'll use the latest data as a baseline for your service level objectives, and you'll be able to edit the SLI and SLOs afterwards.
You can learn more about our suggested service levels in our docs.

Improvements
We've added suggestions and validations for the NRQL queries on the setup flow, so now it's easier to customize service level parameters and exceptions.

Changes
SLO periods now only include complete weeks.
SLO compliance results for rolling time windows are more consistent when they include complete weeks. This way, the calculation always includes the same amount of weekends, and any weekly seasonality doesn't impact the results depending on which day of the week you look at SLOs.
Due to this fact, SLOs with a 30-day period are no longer supported, and any existing SLO previously configured with a 30-day period has been changed to 28 days.
The public beta for service levels is now available to all full platform users.
With the new simple interface for service level management, you'll understand how your services' performance and reliability are doing over time.
Learn how you can configure, consume, and iterate on SLIs and SLOs across all apps and infrastructure in our docs.

