This guide shows you how to optimize your errors so you can improve error rates, error detection, and customer experience. It's part of our series on observability maturity.
Overview
Error tracking is the practice of capturing application errors and error rates so you can address issues affecting your customers' experience of your software.
The aim of this guide is to enable a New Relic customer or team to:
- Calibrate the way that errors are understood by New Relic, so that error related metrics reflect only errors that are meaningful to you
- Lower the incidence of errors over time
Desired outcome
Improve customer experience and reliablity by reducing application error rates and mean time to resolution.
Key performance indicators
Business KPIs
Reducing errors that customers experience improves reliability. Organizations that improve reliability experience higher conversion rates (user journey completion rates) and higher user engagement. This brings organizations closer to meeting their revenue targets (commercial) or social impact goals (non-profit).
The business KPIs above work on the assumption that you support your users by providing a frontend application. If you support your customers via API, it may be possible to fit the above KPIs to the Transaction entity type. Some organizations that provide APIs as a service use operational KPIs like the ones below to promote the quality of their offering.
Operational KPIs
Prerequisites
Required installation and configuration
- Make sure that our , , mobile monitoring, serverless monitoring, or OpenTelemetry solutions are getting your errors.
- Up-to-date source maps for web applications
- Up-to-date symbolification for mobile applications
Establish the current state
Create a workload for your applications
Define the list of applications and services for which you are trying to optimize errors. The team conducting the error optimization process should have full responsibility for and control of these apps and services. Once you have decided, set up a workload for these entities.
Workloads are a group of entities (applications, instances, etc.) for which a specific team is responsible. They allow you to look at data for only the entities you can do something about. We'll be basing most of our work going forward around the workload you set up here.
It only takes a few minutes to set up a workload. See the workload instructions.
If you're already familiar with workloads and prefer to divide your applications and services into multiple workloads, you can. Just follow the steps below for each workload.
Create service levels for your workload
Service levels allow you to easily configure and view Service level objectives (SLOs) for a given group of entities. Using service levels is one way you can monitor and communicate the success of your error management project.
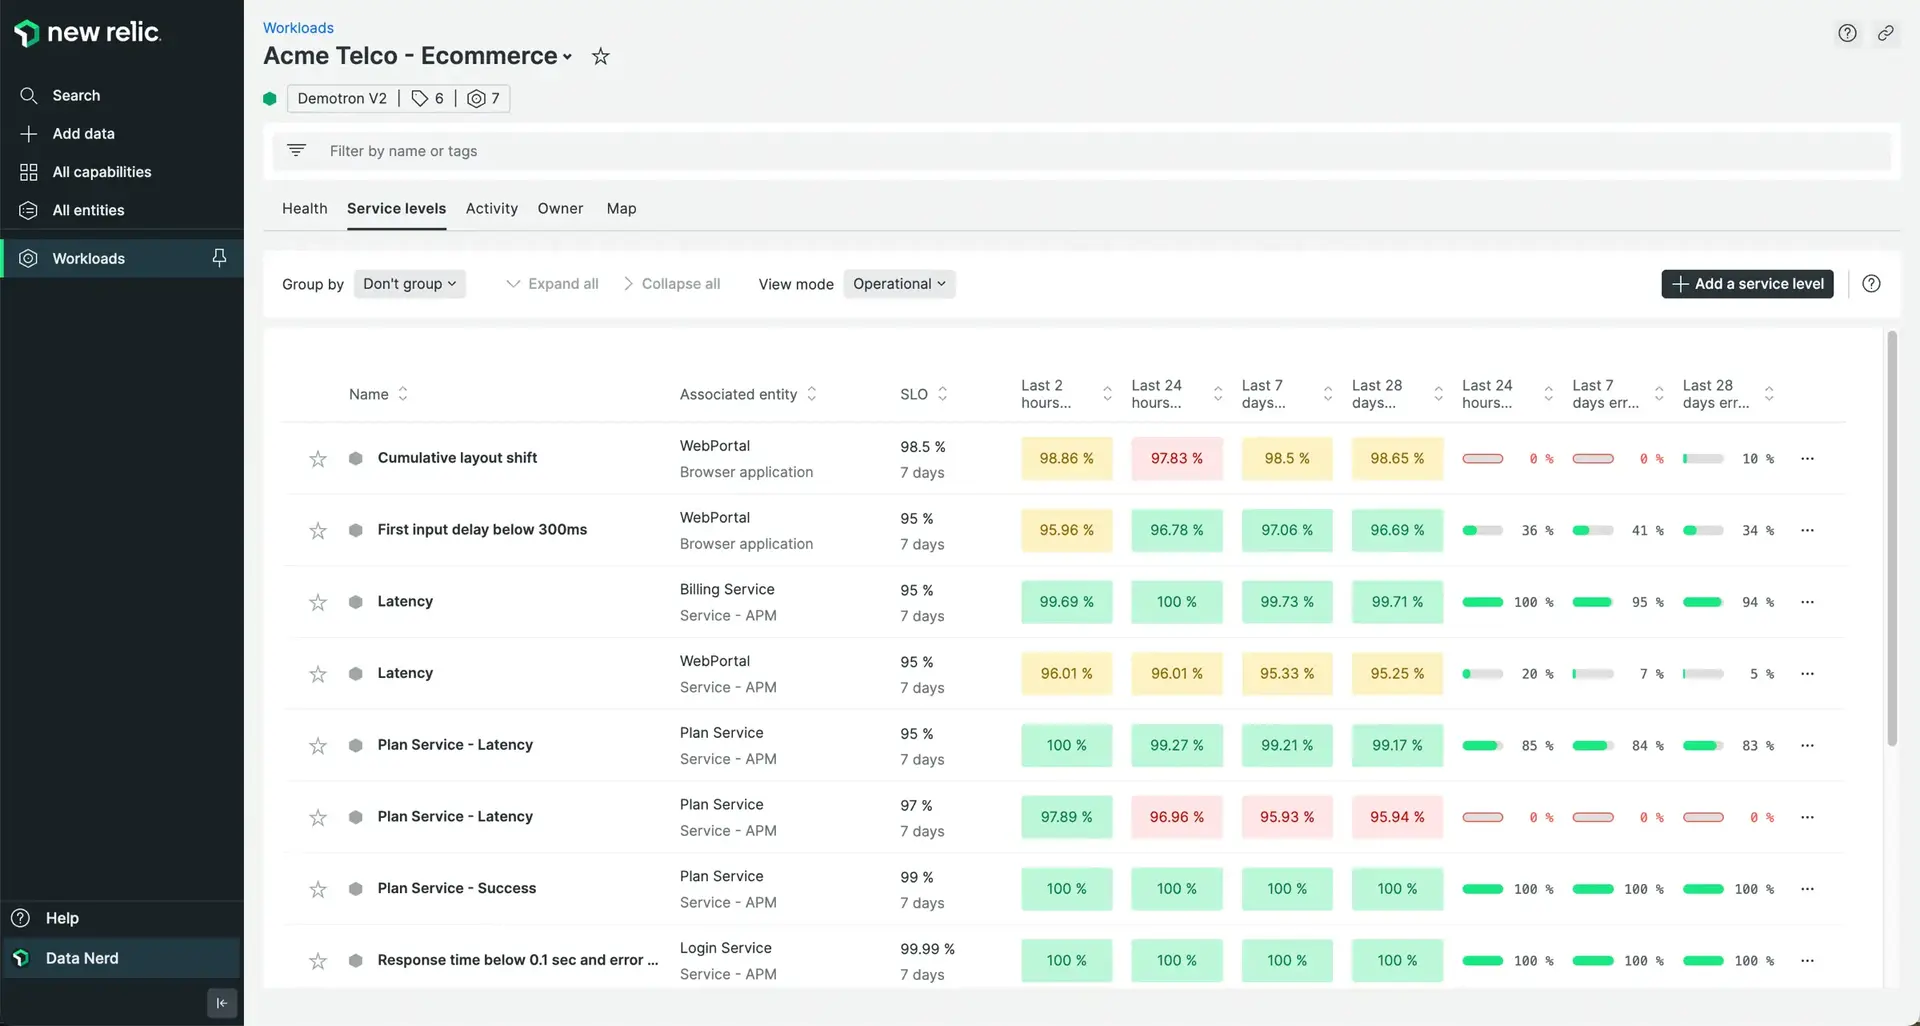
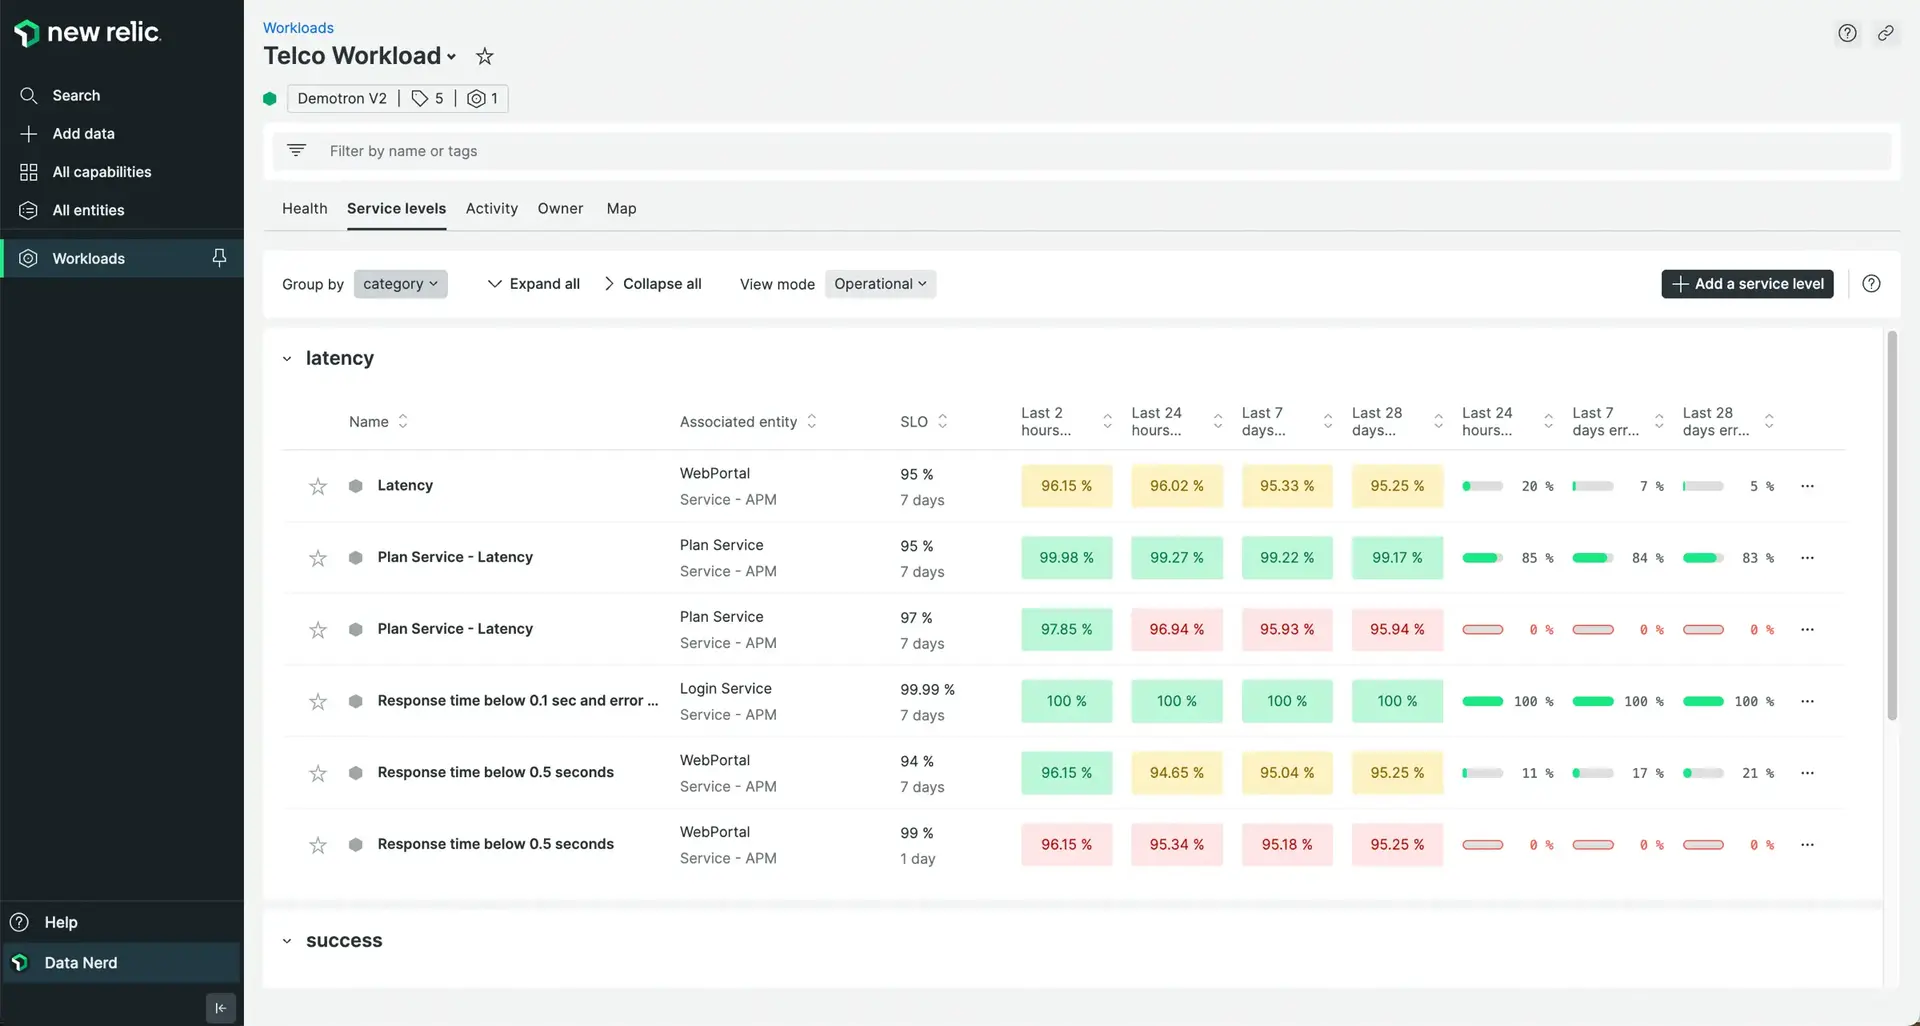
From your workload, navigate to the Service levels tab. Create a service level that measures error rates for each entity in the workload. This is configured in Step 2 in the service level UI. For each service level, use the WHERE clauses to filter out good requests or errors that shouldn't be factored in.

Use Service levels to track your progress against current error rates
Using the process documented above, you've created Service levels based on your current error rates.
- The SLO column shows you the targeted error rate you selected using a baseline.
- The Operational view mode shows you recent performance against your target.
- The Period over period view mode shows you performance against your target over a longer period of time.
- You can update error rate targets as improvements are made.

Improvement process
- Identify inconsequential errors
- Remove inconsequential errors from your error rate
- Set up error rate alerts
- Establish an error-hero roster
- Triage errors using errors inbox
- Link errors to JIRA
- Link errors to Slack
- Use CodeStream
Identify inconsequential errors
Explore your errors however you are most comfortable. You can do this using:
- Out-of-the-box views for APM, mobile monitoring, JavaScript errors, serverless monitoring, and OpenTelemetry
- Errors inbox filtered for your workload
- NRQL data types such as
TransactionError,JavaScriptError,MobileRequestError,AwsLambdaInvocationError,Span
Remove inconsequential errors from your error rate
You can remove errors that don't matter in one of two ways:
- Stop them from being ingested using configuration (APM only) or using drop rules. This approach only works for errors that you are certain don't need capturing. The added advantage of this approach is reduction in ingest for noisy errors.
- Use NRQL to filter the errors out of service level calculations. Do this by adding onto the WHERE clause filter of bad responses. Be sure to re-base the service level if this improves the error rate signficantly. Doing so will improve error alerting accuracy.
Set up error rate alerts
Review each of the service levels set up in Create service levels for your workload and create an alert to notify the team when error rate increase beyond an acceptable rate.
Establish an error-hero roster
Alerting will let you know if you are meeting the current levels of error performance but won't help you improve them. To improve customer sentiment, create a process where errors are reviewed daily by a member of your team. The error hero should:
- Initially focus on errors that happen above the fold. For a daily review process this means focusing on errors that happened only in the last 24 hours.
- Triage errors using Errors inbox
Triage errors using errors inbox
Errors inbox is a single place to proactively detect, triage, and take action on all errors before they impact customers. Similar errors will be grouped together to avoid duplication of work and to allow you to prioritize errors by number of occurrences.
When accessing errors inbox, be sure to select your workload so that you're only seeing errors relevant to your team.
Set aside a regular time to go through errors inbox as a team. To begin with, daily or a few times a week makes sense as you will have a lot of error groups to go through. Later, weekly or bi-weekly may be more appropriate.
Go through the errors one by one by clicking into the error details screen when necessary to get more information such as traces, logs, etc. This will either point to a cause of the error or provide a starting point for further investigation.
After brief discussion you may be in a position to mark the error group as one of the following:
- Ignore: For use when the error is not problematic. This will hide the error group from the inbox view from that point on.
- Resolved: For use when the error was the result of a known issue that has now been fixed. This will remove the error group from the list unless it recurs. If it does recur, the fix implemented previously should be re-thought.
Note: Ignoring and/or resolving errors via errors inbox will not stop them from counting towards error rate metrics.
If neither of the above statuses is suitable, assign the error to the appropriate team member for further investigation and resolution. That team member can conduct further investigation in their own time, updating the error group notes with their progress and/or asking for help from other team members via the notes section.
At the next triaging meeting you can revisit these error groups to see if they can now be marked as resolved. As time goes by, you should start to see fewer new error groups appearing, and positive movement in your KPIs.
Link errors to JIRA
As you get into more edge-case or complex errors, you might find you need to ask for help from other teams. Linking errors inbox to Jira may help with this. Connect your Errors inbox to Jira to enable you to easily create tickets connected to error groups. You can control the information sent to Jira via Jira templates.
Link errors to Slack
As the velocity of errors coming into errors inbox goes down, a regular team session may no longer be a good use of time. An alternative is to link Errors inbox to Slack and either a) designate a rotating person to monitor the channel and resolve/ignore/assign error groups as they come in or b) allow the team to proactively respond to error groups.
Use CodeStream
Many of your error groups are going to require code changes to resolve. Connect CodeStream to your New Relic account to open the offending code directly in your IDE to investigate the code directly. You can also leave notes and comments on specific lines of code for developers to review and vice versa.
New Relic with CodeStream gives you more context on your error groups, such as being able to see version numbers or commit SHAs. Additionally, using errors inbox as a centralized place to identify, discuss, and rectify code issues allows you to respond to code problems efficiently and avoid duplicating work.
Value realization
Review error rates weekly as you progress through the practice. As error rates decrease, you should see faster mean time to resolution and increased customer satisfaction.


