We know that everyone comes to New Relic with their own, unique telemetry data needs. Whether you're trying to mitigate downtime or analyze the success of a new feature, there isn't a one-size-fits all solution. We redesigned the New Relic UI to allow your team easy access to the specific data you need right when you need it, without being bogged down by unnecessary tools and information.
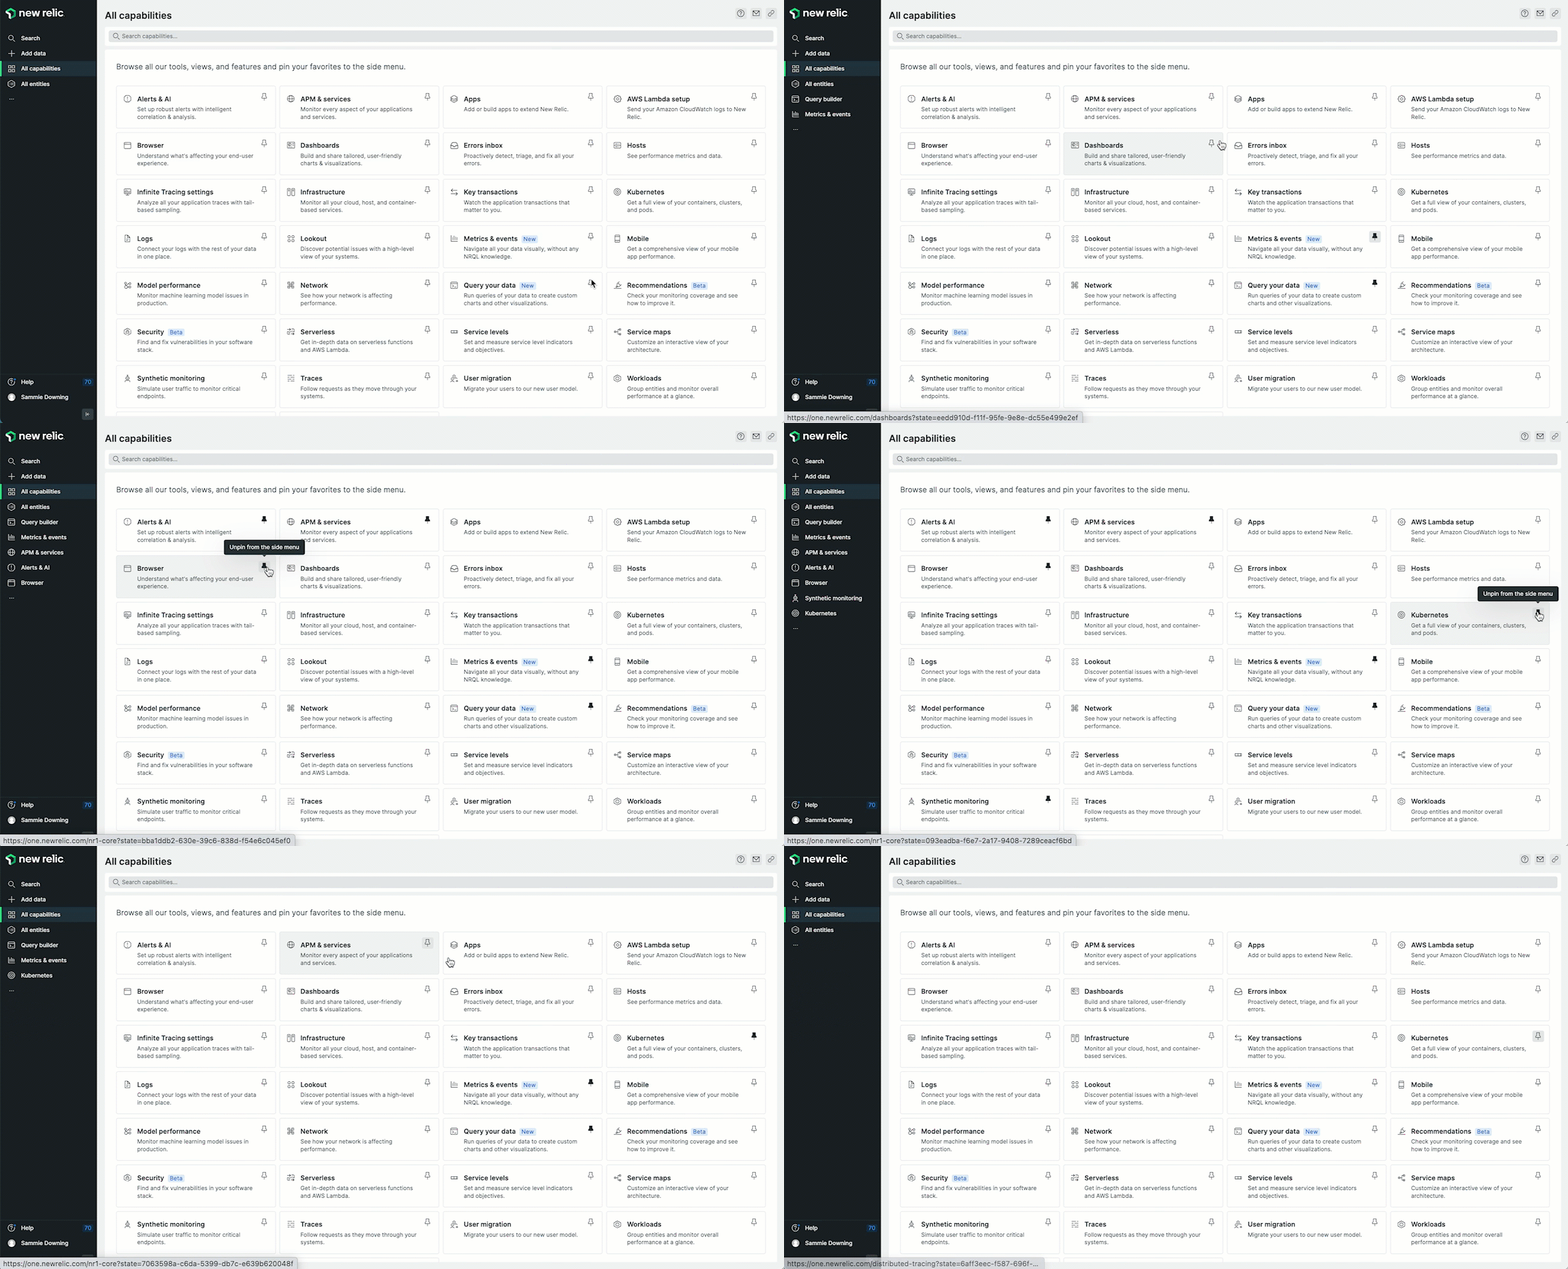
Now you can customize the UI as much and as often as you like, so that it can change as your needs do.
You're in control and we want you to take the wheel and make New Relic yours.
- There's more space. By clearing away UI from the top and sides, we've given you more space to focus on what matters: your data. You can even collapse the left nav to give yourself even more room.
- See what you want to see. The left nav is fully customizable so you can jump more quickly to what you use most. Add the tools, views, and features you use the most, and change it as often as you like.
- The left nav is stable. No matter how often you click around within a capability or a feature, the left nav is a steady and stable place for you to return to in the UI.
- Work in the dark. Our designers have refined and crafted our dark mode into an elegant experience for those of you who like working in the dark.
Make New Relic work for you
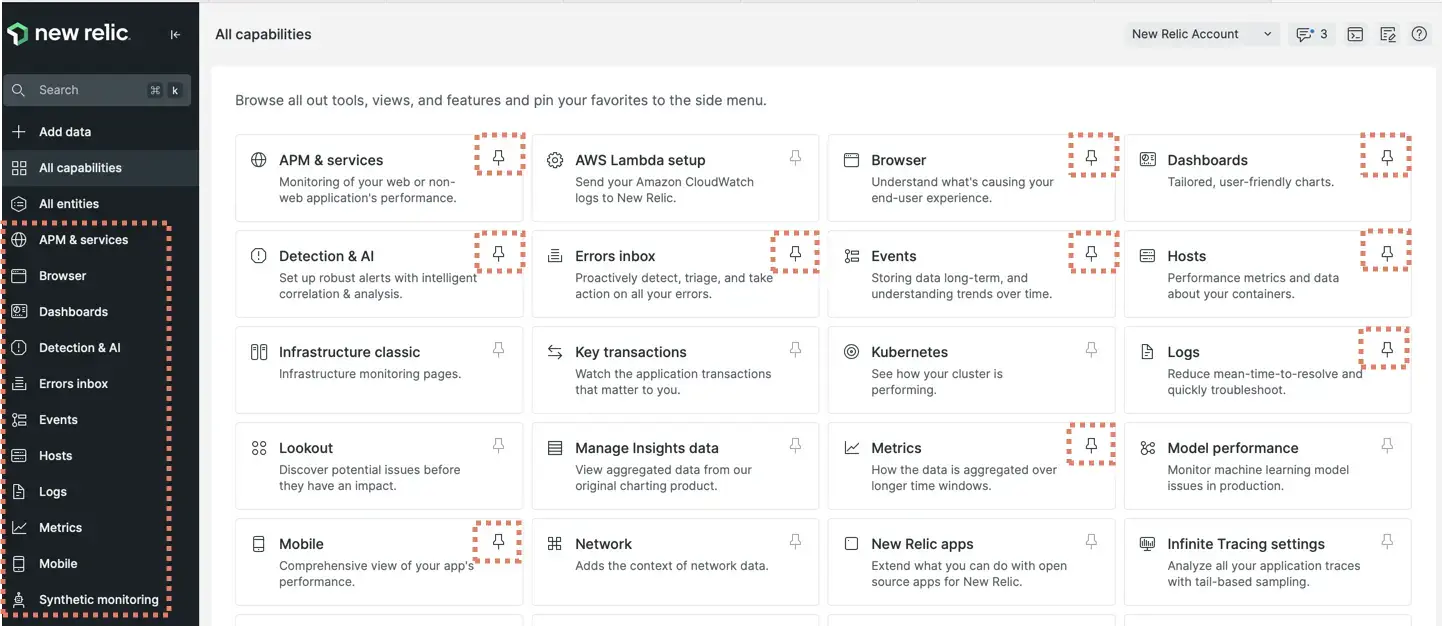
Dealing with increasing complexity across your stack requires intuitive access to telemetry data. You can now customize New Relic for easy access to the tools you use every day.
Go to All capabilities to see a catalog of all of our tools, views, and features. Click around to discover and learn more about things you aren't using and to try out new solutions to your problems.
Do you use something all the time? Click its pin to stick it the left nav for easy access. Click an active pin to remove that capability from the left nav.
But, before you start, here are our recommendations for how to begin customizing your New Relic experience.
Pin the query builder for easy access to your data
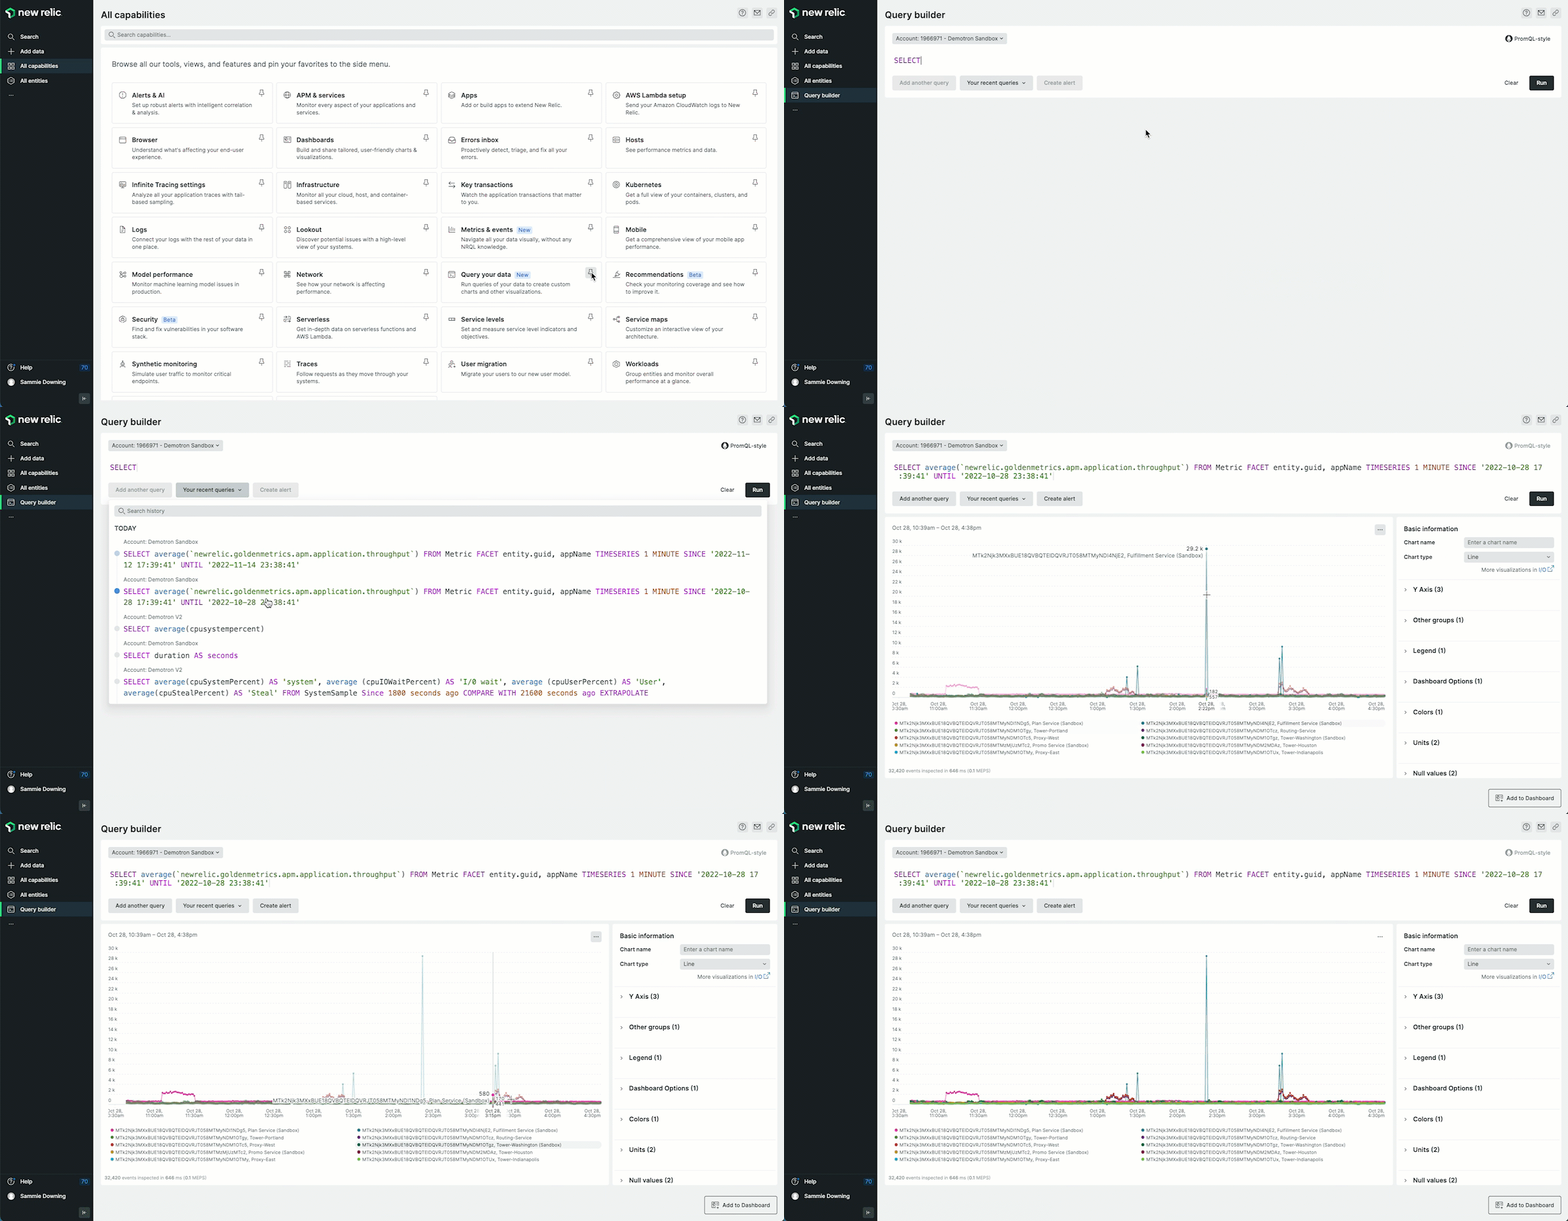
Pin the query builder to the left navigation to quickly access your data.
Before you dig into making New Relic your own, the first thing we recommend is that you go to All capabilities and click the pin next to "Query your data." This will permanently stick the query builder to the left navigation. Our query builder allows you an easy way to filter, organize, and understand your data.
- Quickly access your data and build customized charts to learn and understand the health of your infrastructure, applications, and other services.
- Add charts to your dashboards to obtain a complete real-time view of the state of your system.
- Share your charts with colleagues or users in just two clicks.
- Create NRQL alerts from the queries you build and run.
Metrics and events
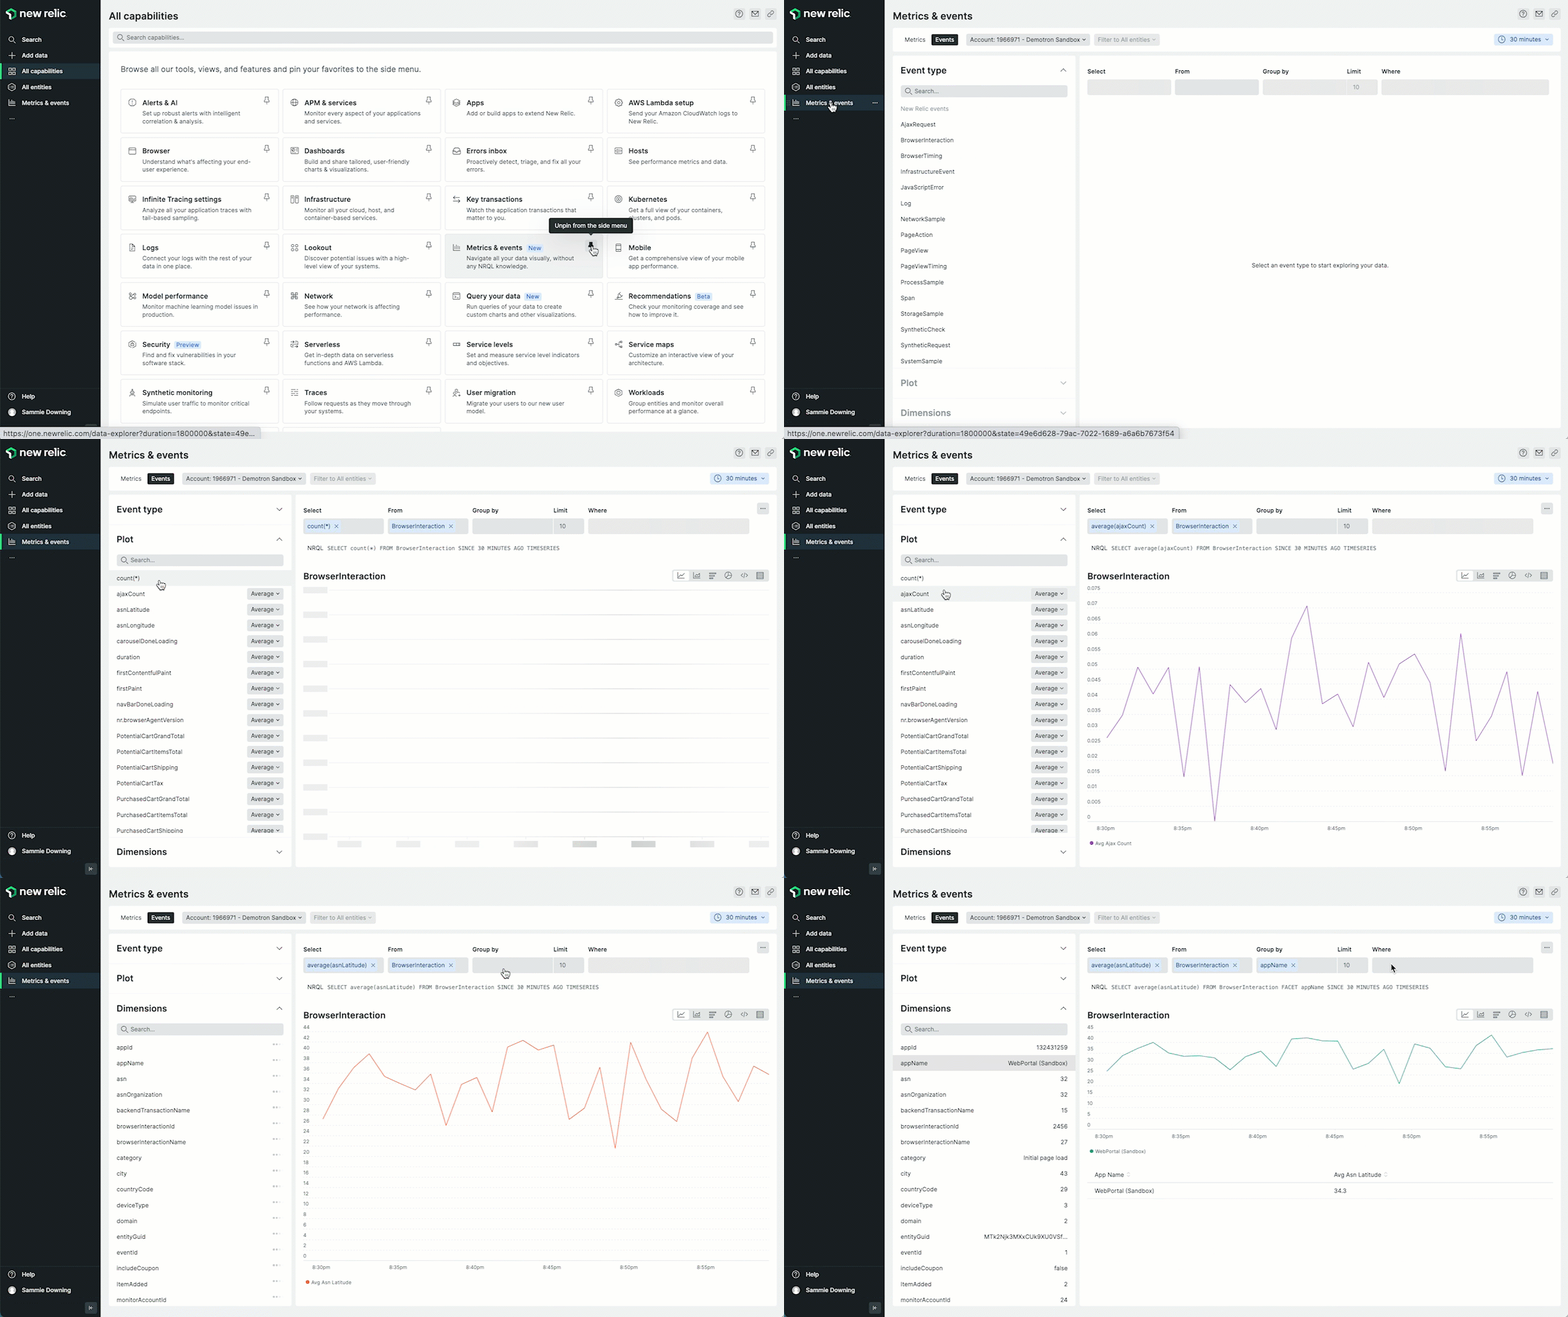
Our second recommendation is that you go to All capabilities and pin "Metrics and events" to the left navigation. Formerly included in the UI as the "data explorer," metrics and events allows your team a birds-eye view of all the data coming into your system. You can use metrics and events to fetch, identify and understand all your data stored in the New Relic database (NRDB) through visual tools. You can explore your data without having to run any queries making it one of the simplest tools for gathering information about the health of your system.
Browse for any technology you use
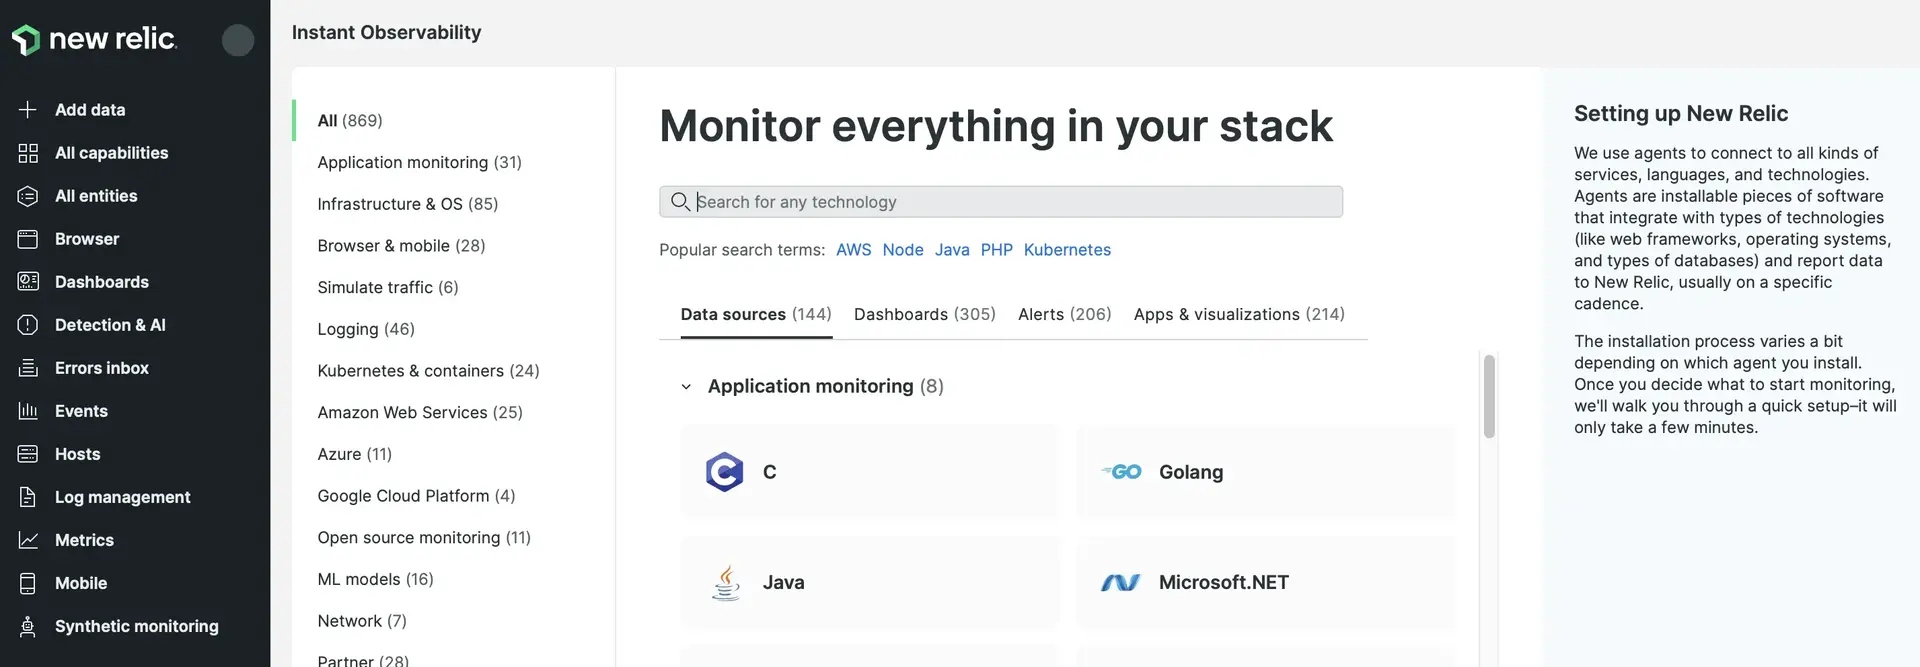
In the left nav, go to + Integrations & Agents to see a catalog of hundreds of New Relic-compatible data sources, pre-built dashboards, useful alerting conditions, and other apps and visualizations. If you're using a technology, chances are good we can monitor it for you.
Not only that, our catalog guides you through the installation process by pointing you to interactive installation paths and specific docs so you can get started as quickly and painlessly as possible.
Customize your experience
Once you've added the query builder and metrics and events you're ready to design your own unique experience.
See everything you're monitoring in one place
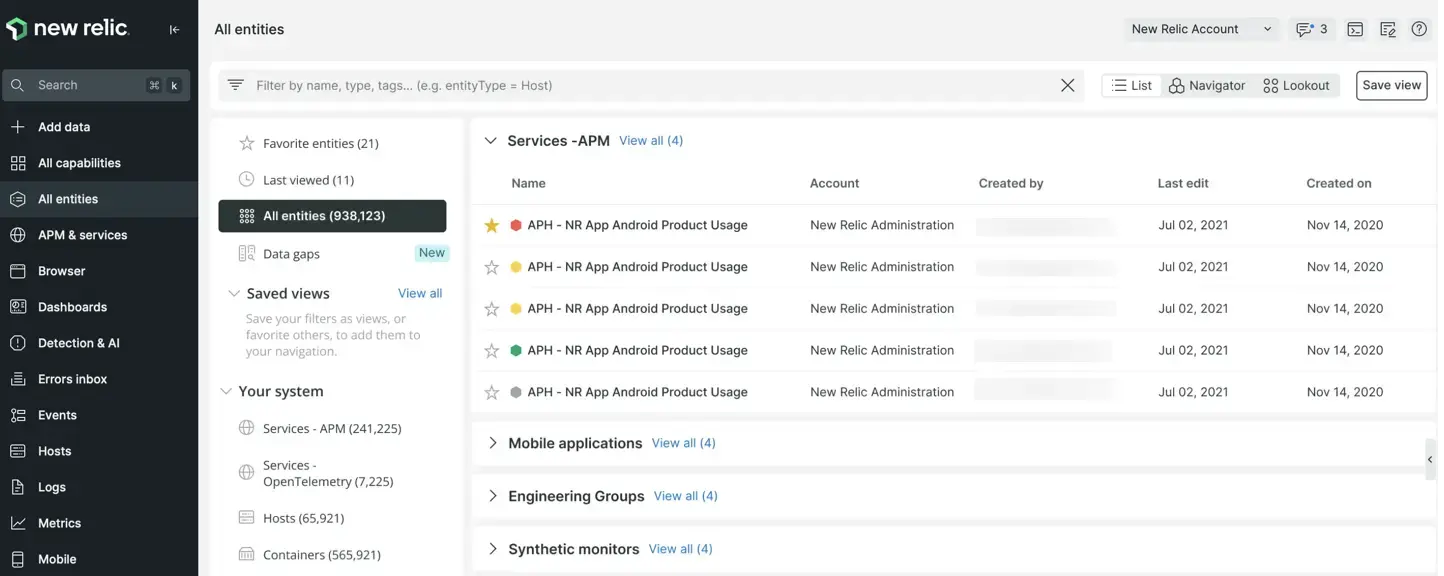
Go to All entities to see all of your monitored entities in one place. Use this to see everything you're monitoring and dig deep into the details of what's happening.
We've moved the user menu
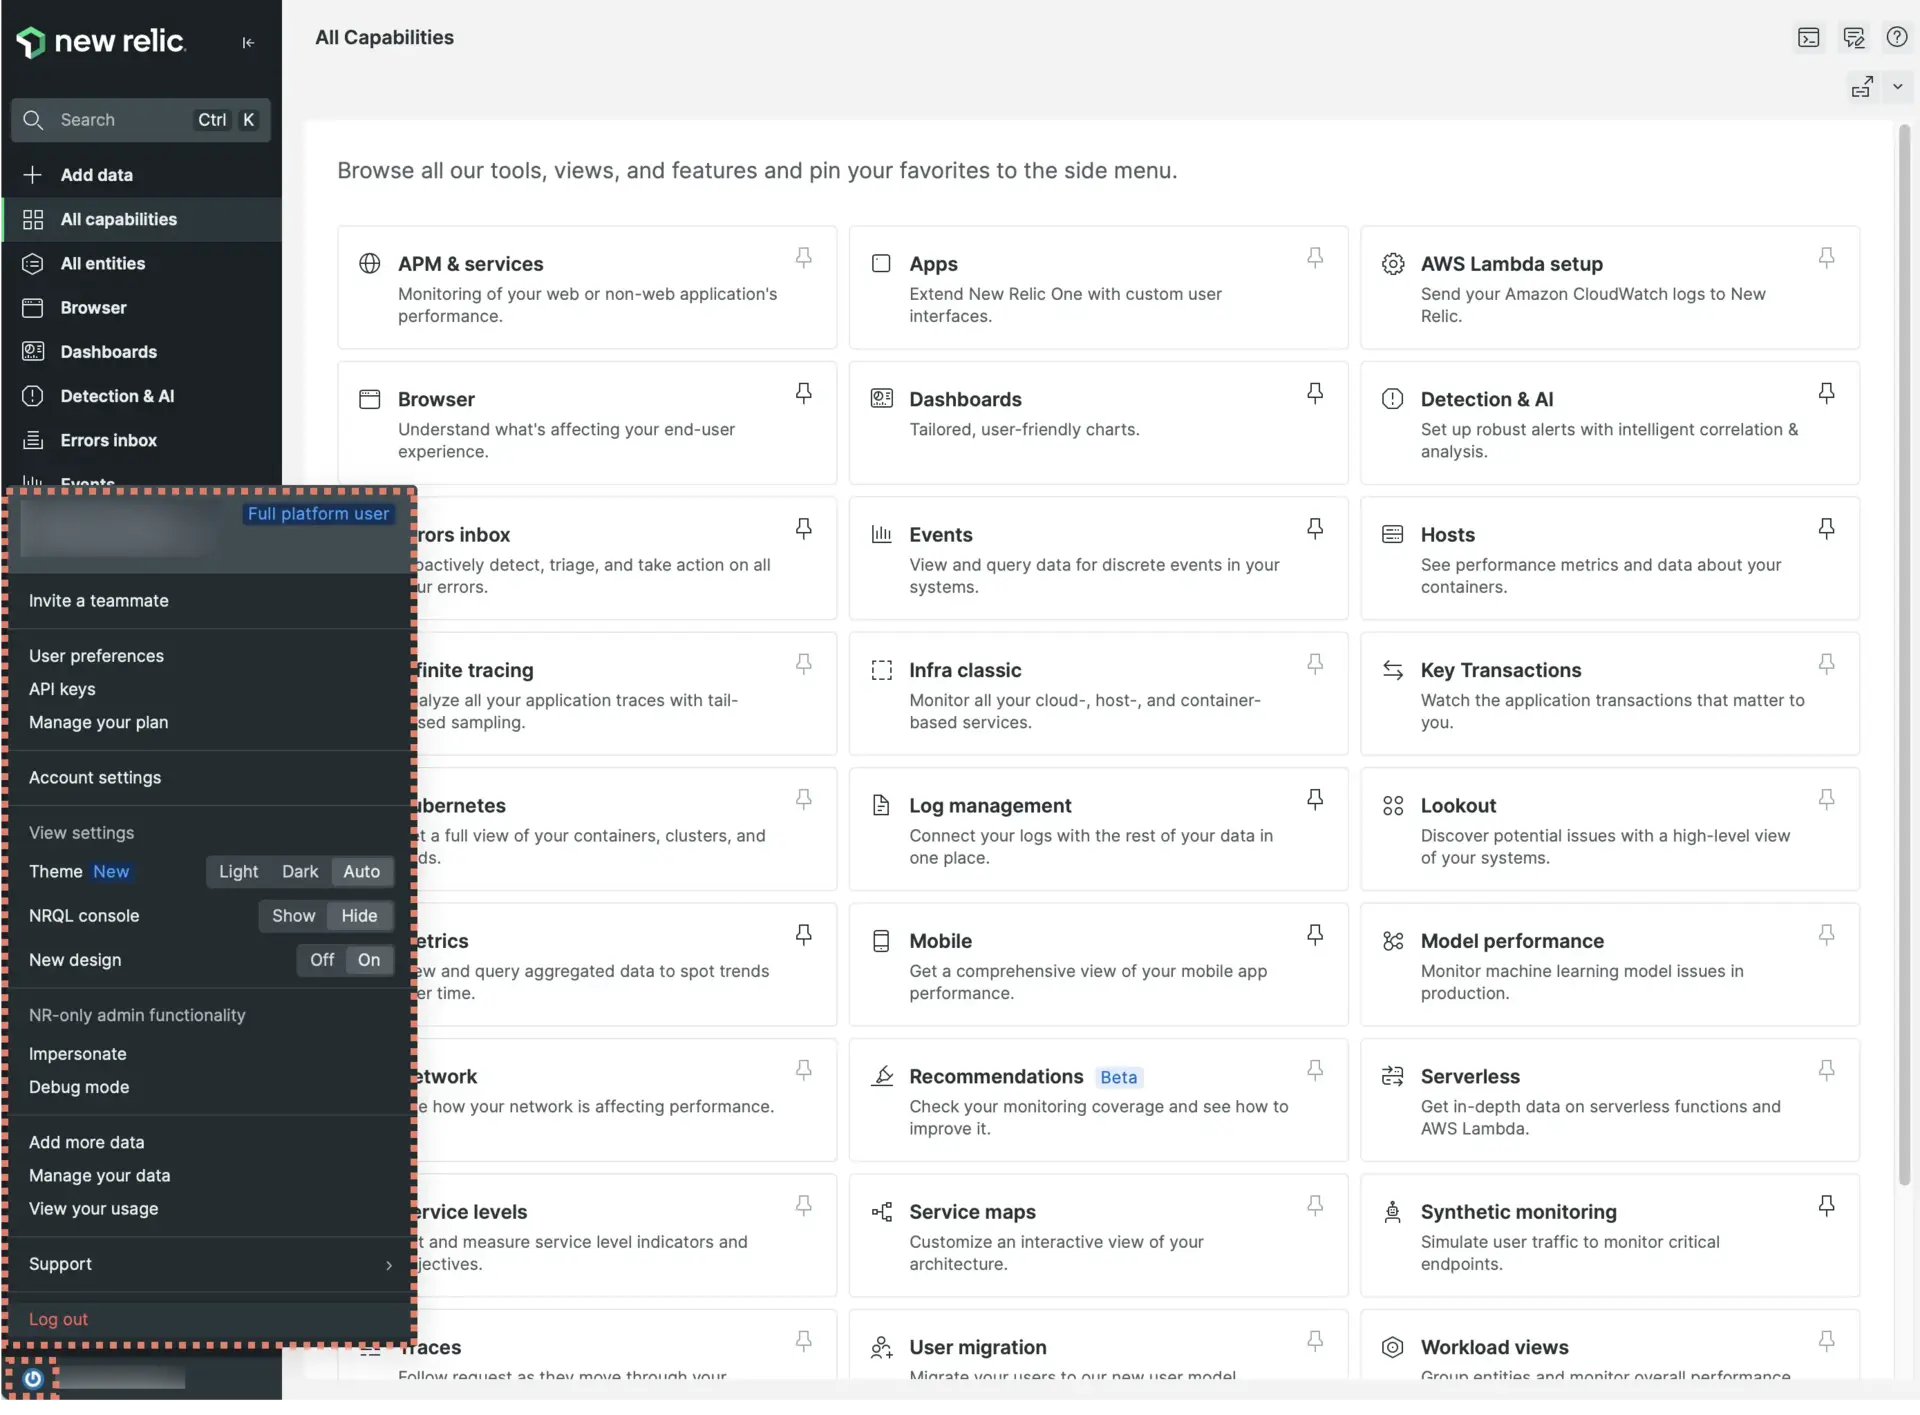
Find your user menu in the bottom left corner of the UI. Use it to invite a teammate to New Relic, set your user preferences, switch to dark mode, find or create API keys, and change other settings. To find details about these options, see Account settings.
You can also use this menu to switch back to the old UI.
Leave us feedback wherever you are
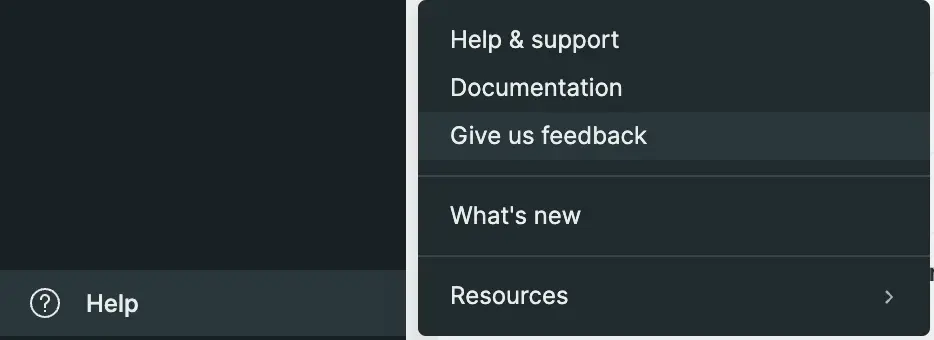
One thing isn't changing: we want your feedback. The feedback button is still there, in the bottom left corner of the UI.
If you have thoughts to share on our new UI, we'd love to hear it, good or bad.