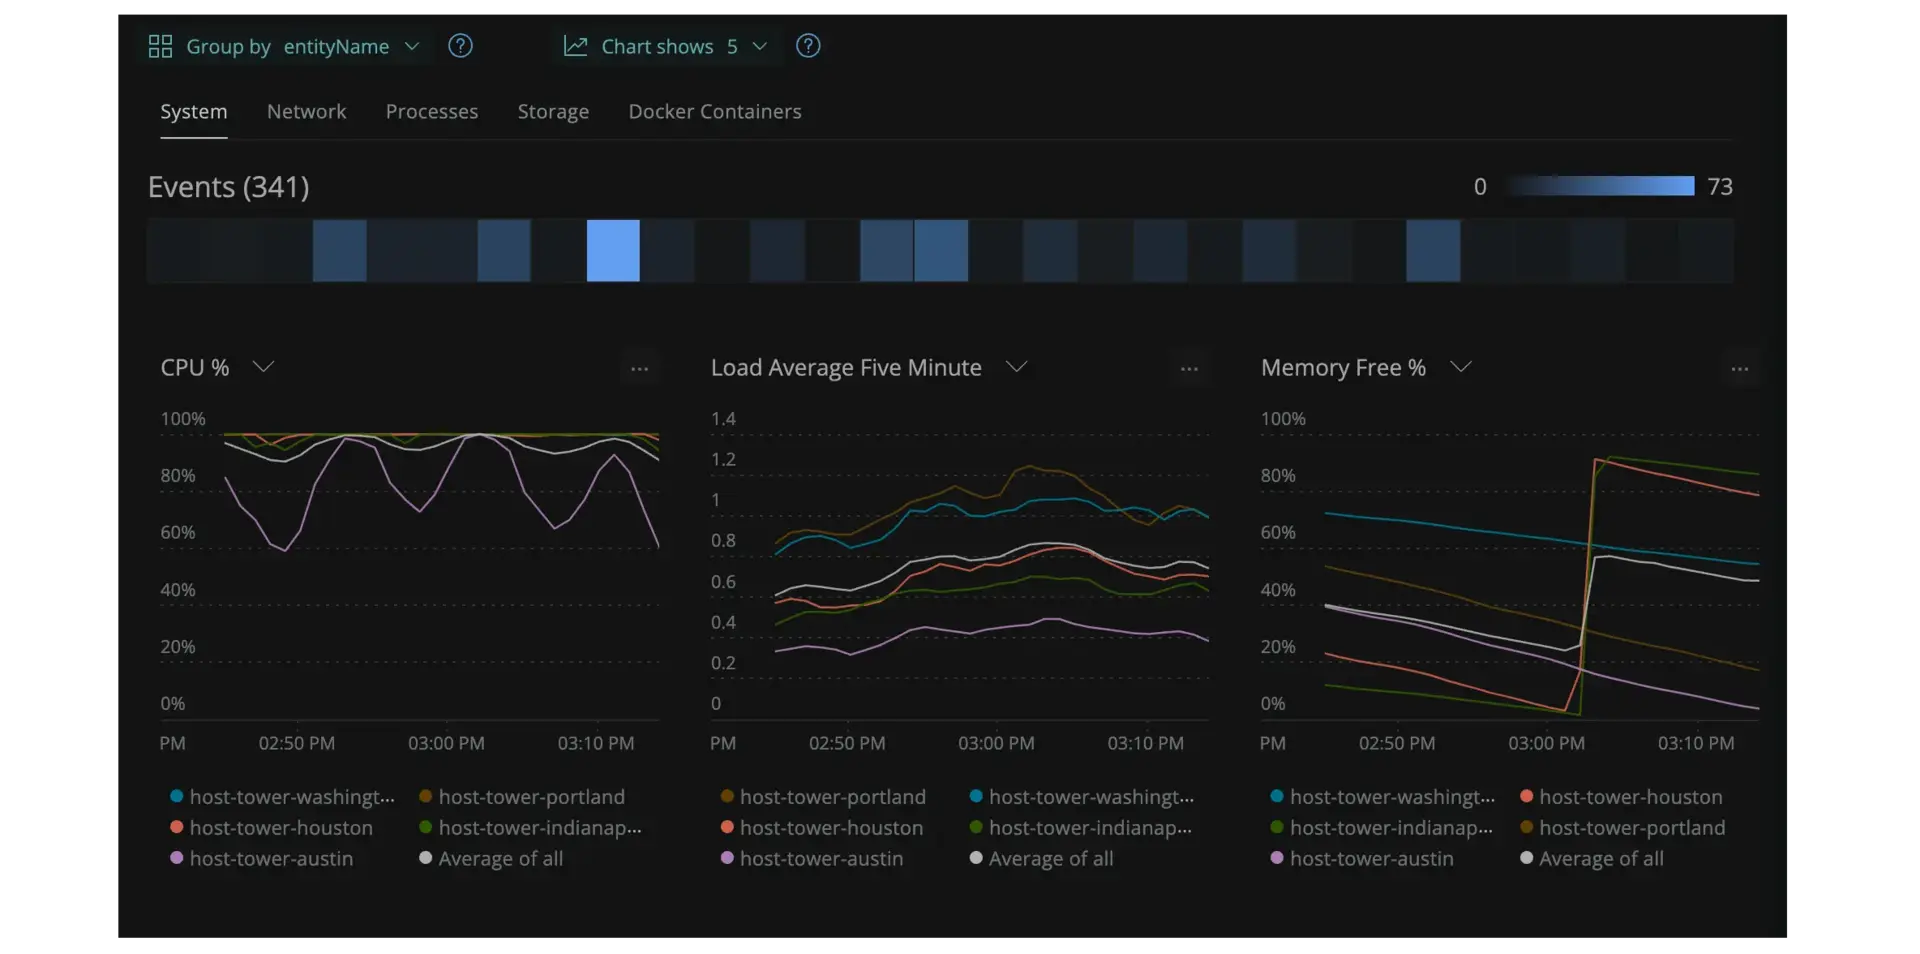
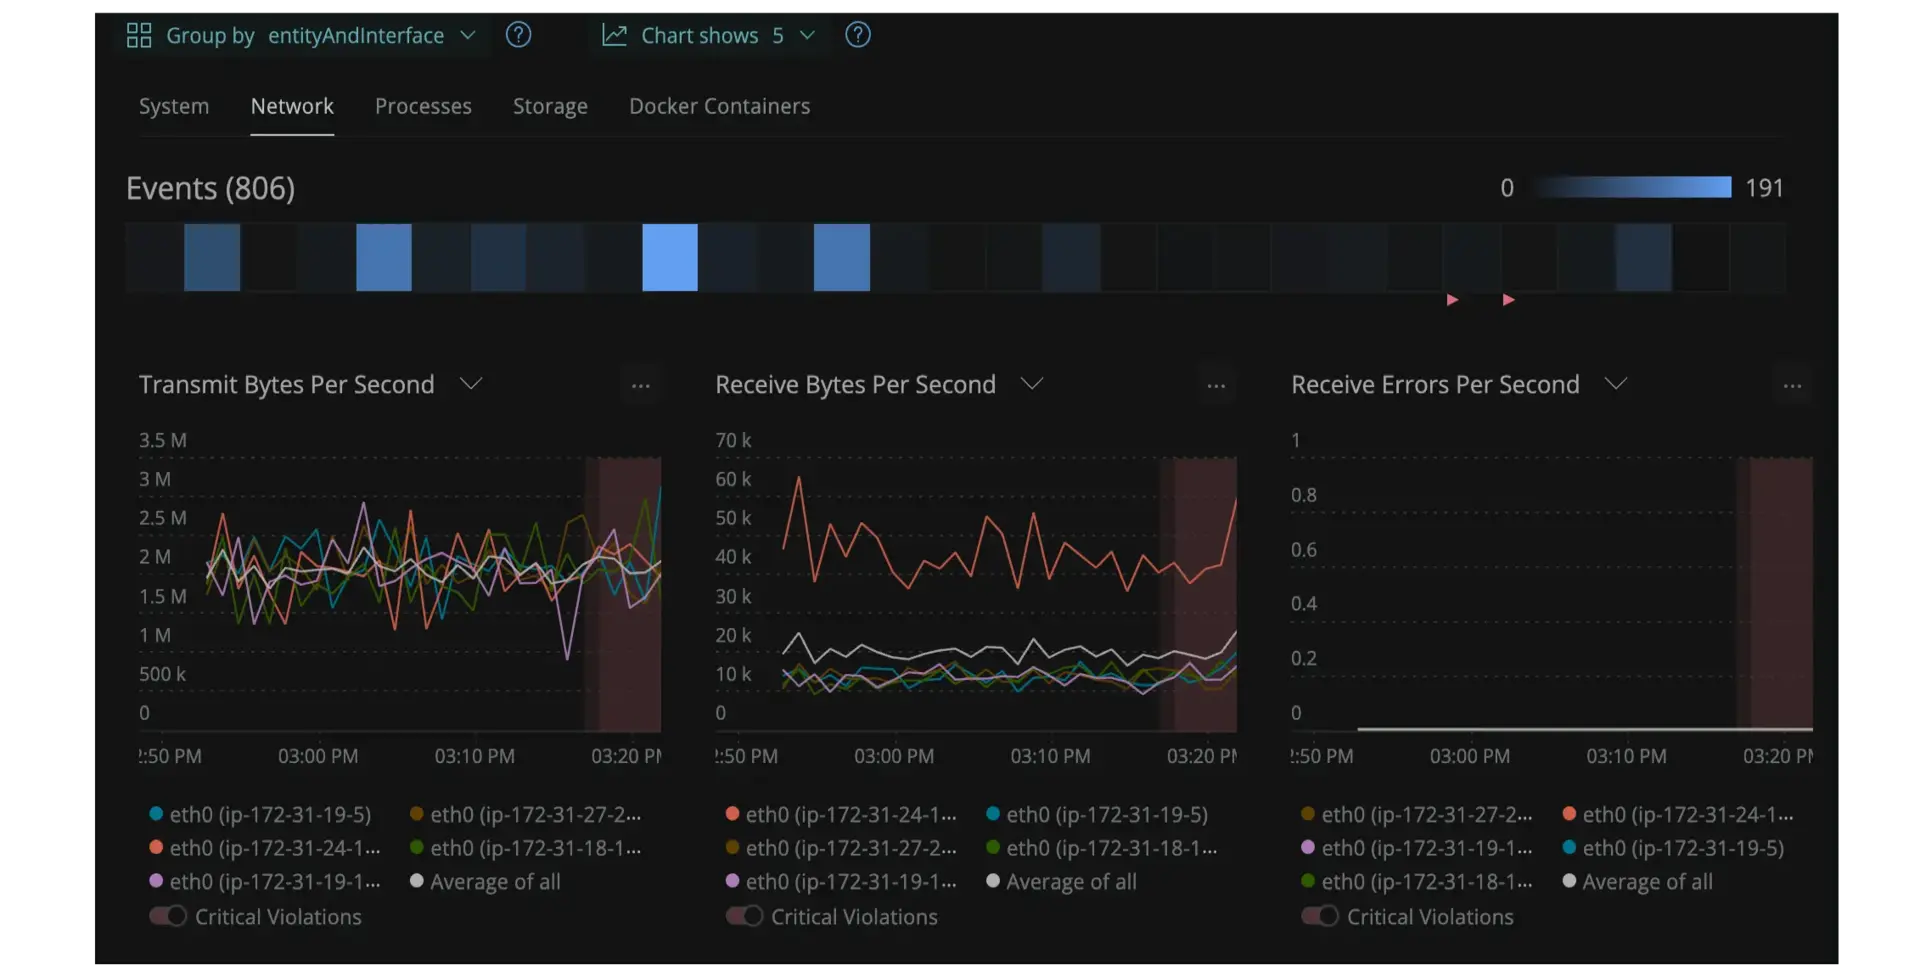
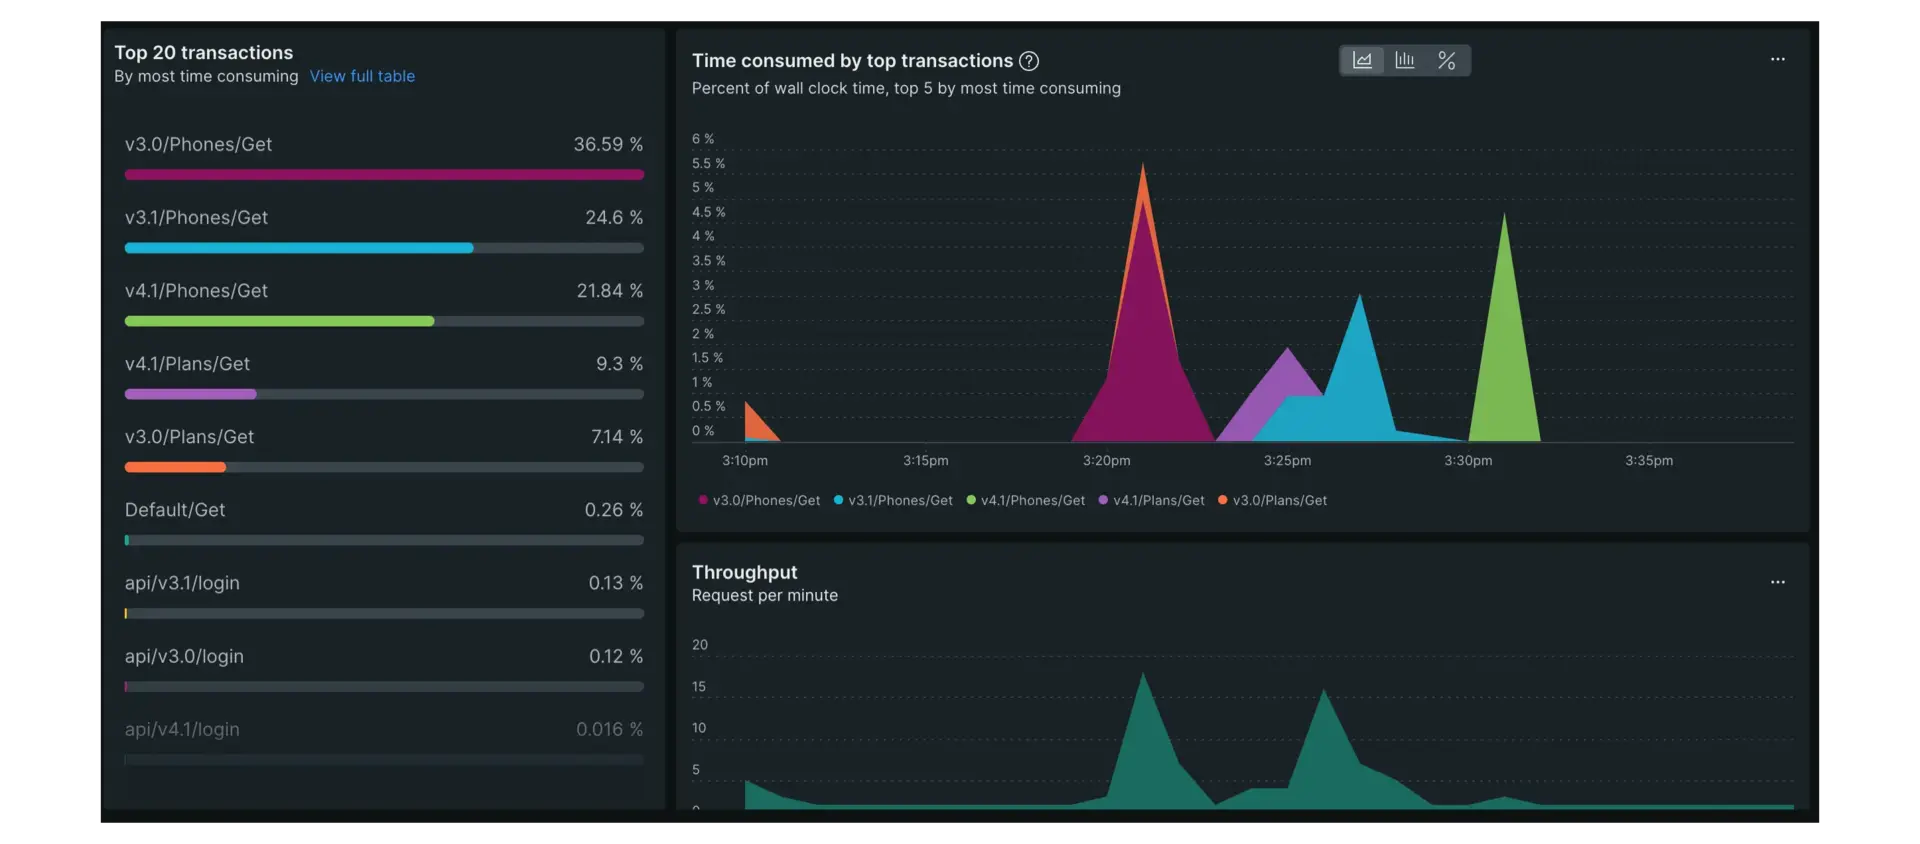
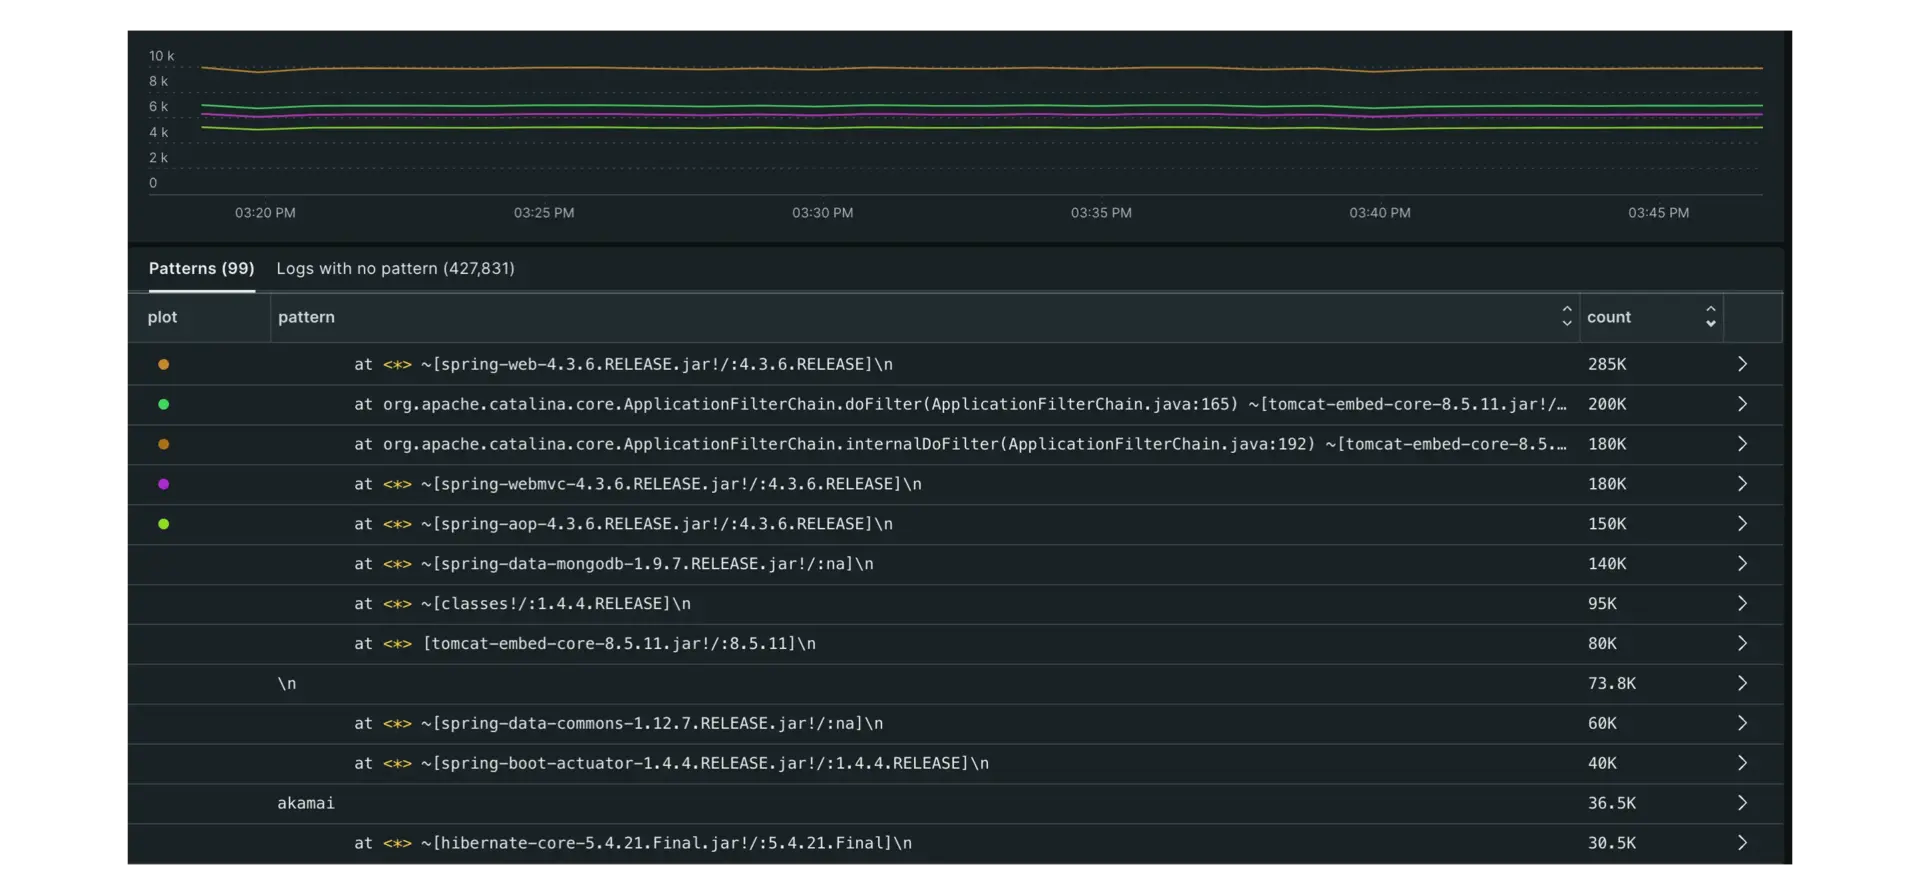
The first step to trying out New Relic for yourself is ingesting some data to monitor. The most useful places to start are an infrastructure agent, application monitor (APM), or log monitoring capabilities. Once you do, you can begin visualizing your data immediately using our automatically generated, highly granular dashboards. You can also setup premade dashboards and alerts, or begin using any of the other advanced features listed in the final doc of this series.
Nearly any feature you want to try will be available to you for free once you install a monitoring capability: just choose one an option below to get started!
Monitoring your infrastructure can be daunting. Gathering the data from your servers, databases, cloud platforms, and hosted services is only the first task, and once you've set all that up, you still need to find ways to make sense of it all.
New Relic makes it easy for you to see what's going on inside your infrastructure, whether it runs in the cloud or dedicated hosts. In Datadog, you may be familiar with these capabilities as agents, and we call the same infrastructure capabilities agents at New Relic as well.
Here's how we organize our infrastructure agents and integrations:
Infrastructure agents for Linux, macOS, and Windows operating systems with guided and manual install options
An agent for for Kubernetes
Cloud agents for Amazon AWS, Microsoft Azure, and Google Cloud Platform that you can install independently of our infrastructure agents
On-host integration agents for services like MySQL, Apache, Docker, and Kafka that work together with our infrastructure agent to maximize your data reporting
As long as your system and on-host integrations meet our minimum requirements, all you need to try is a free New Relic account and you can start right away.
Get started with New Relic infrastructure monitoring
Your infrastructure data in New Relic is located in the one.newrelic.com > Infrastructure section of the UI, exactly the same as Datadog. The fastest way to get an infrastructure monitor up and running can be done through our guided installation path, which you can find within one.newrelic.com by selecting Integrations & Agents > All > Guided install.
Select the New Relic account you want to monitor your infrastructure data.
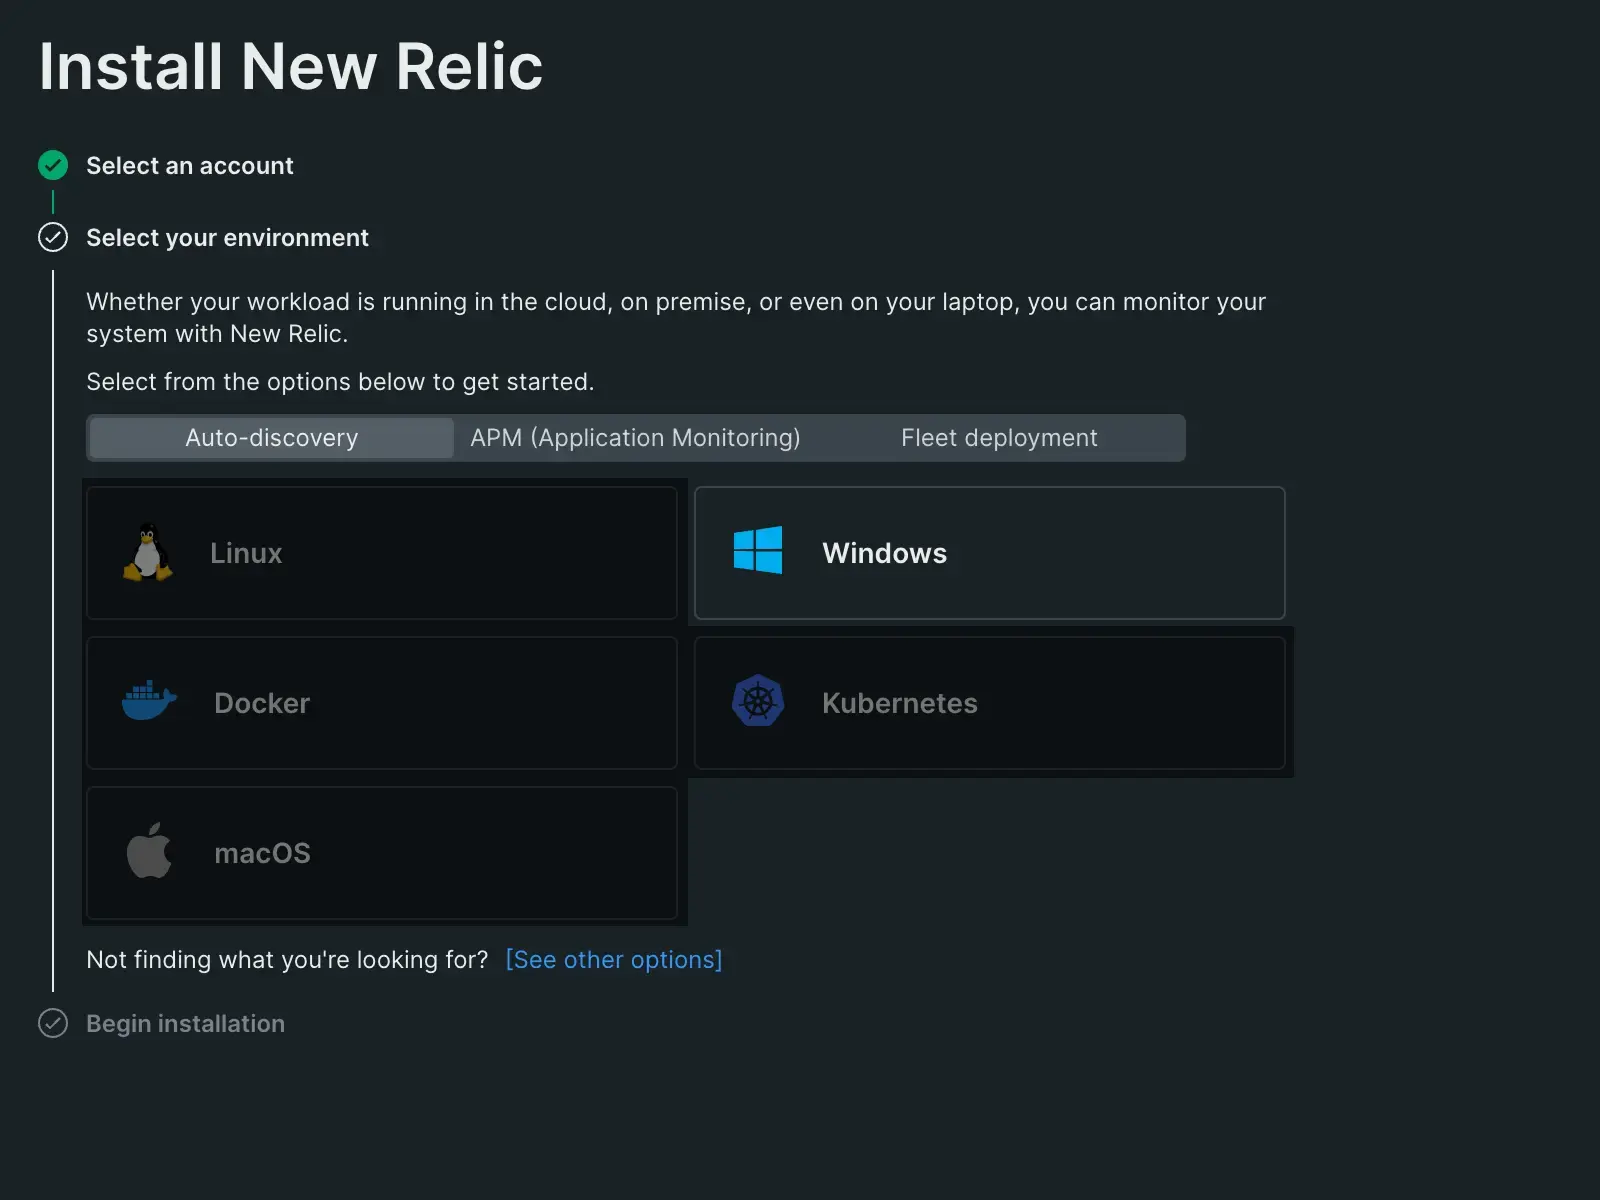
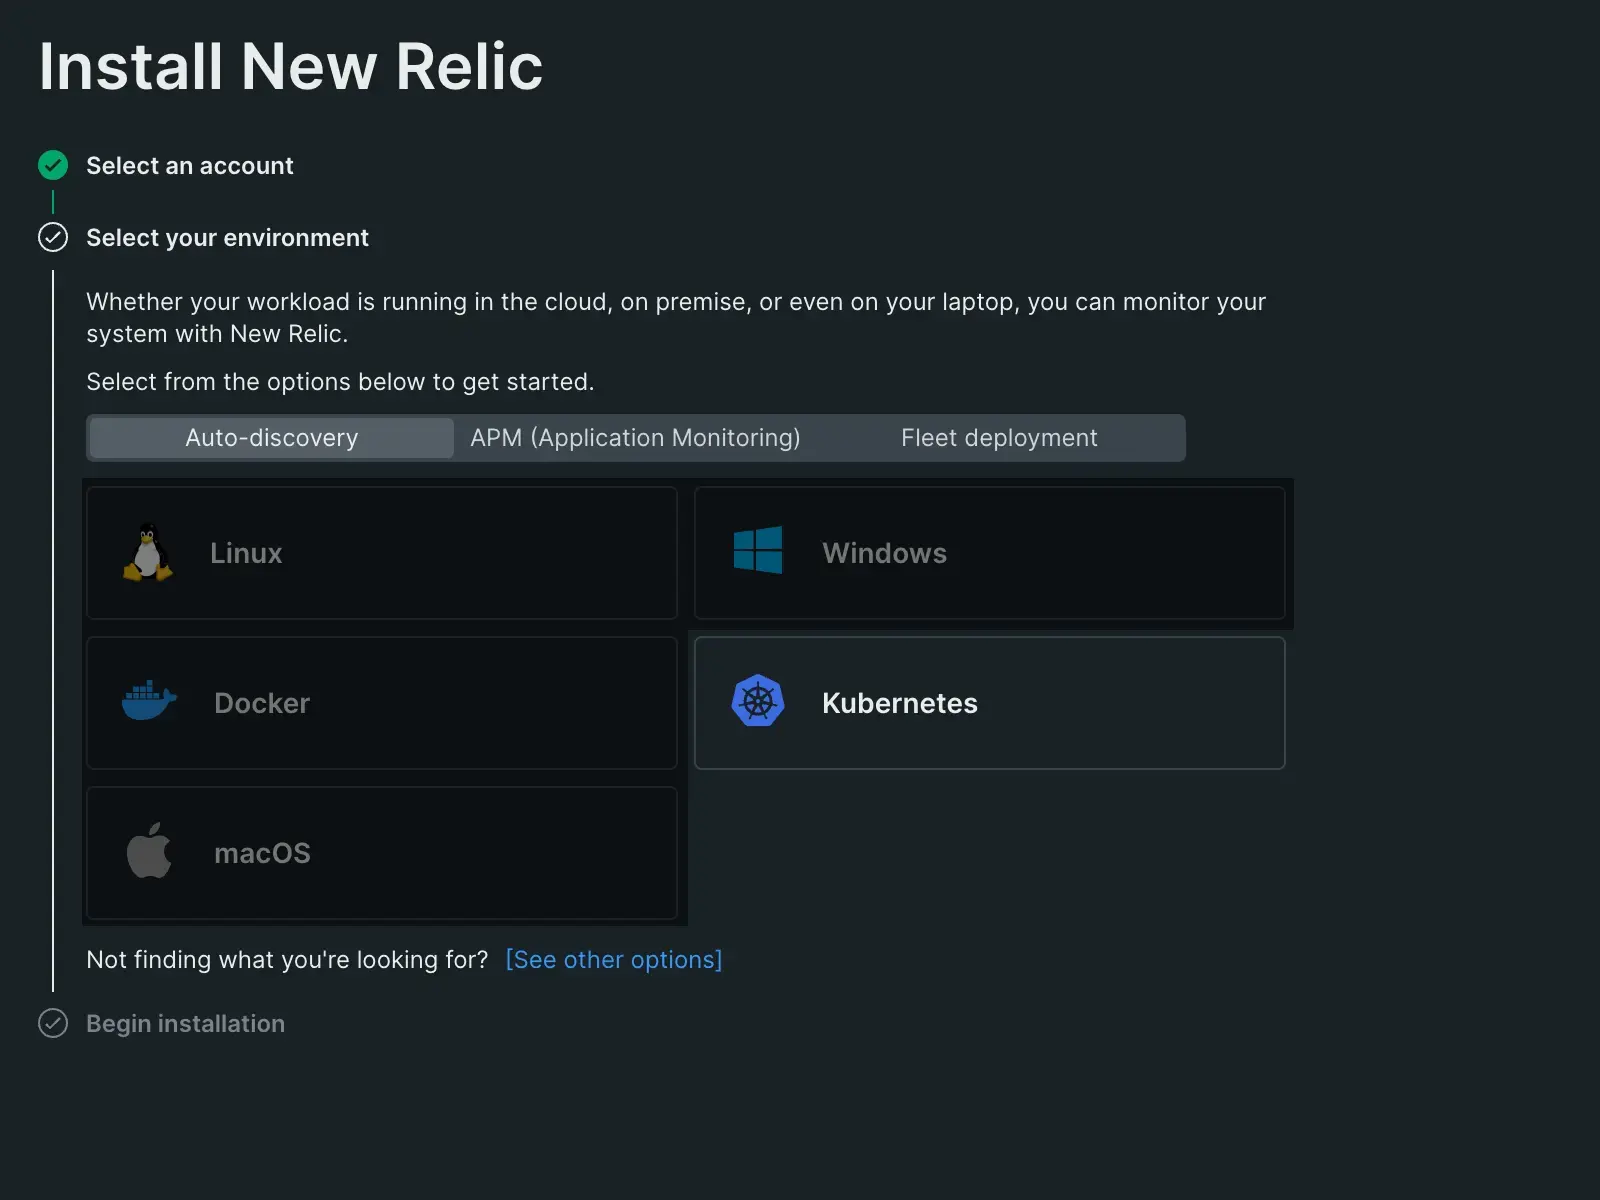
Select Windows under the Auto-discovery section.
Select Begin installation.
New Relic will provide a command for you to run on your Windows system. Just copy the command, open Powershell as an administrator, paste and run the command, and you're done!
Select the New Relic account you want to monitor your infrastructure data.
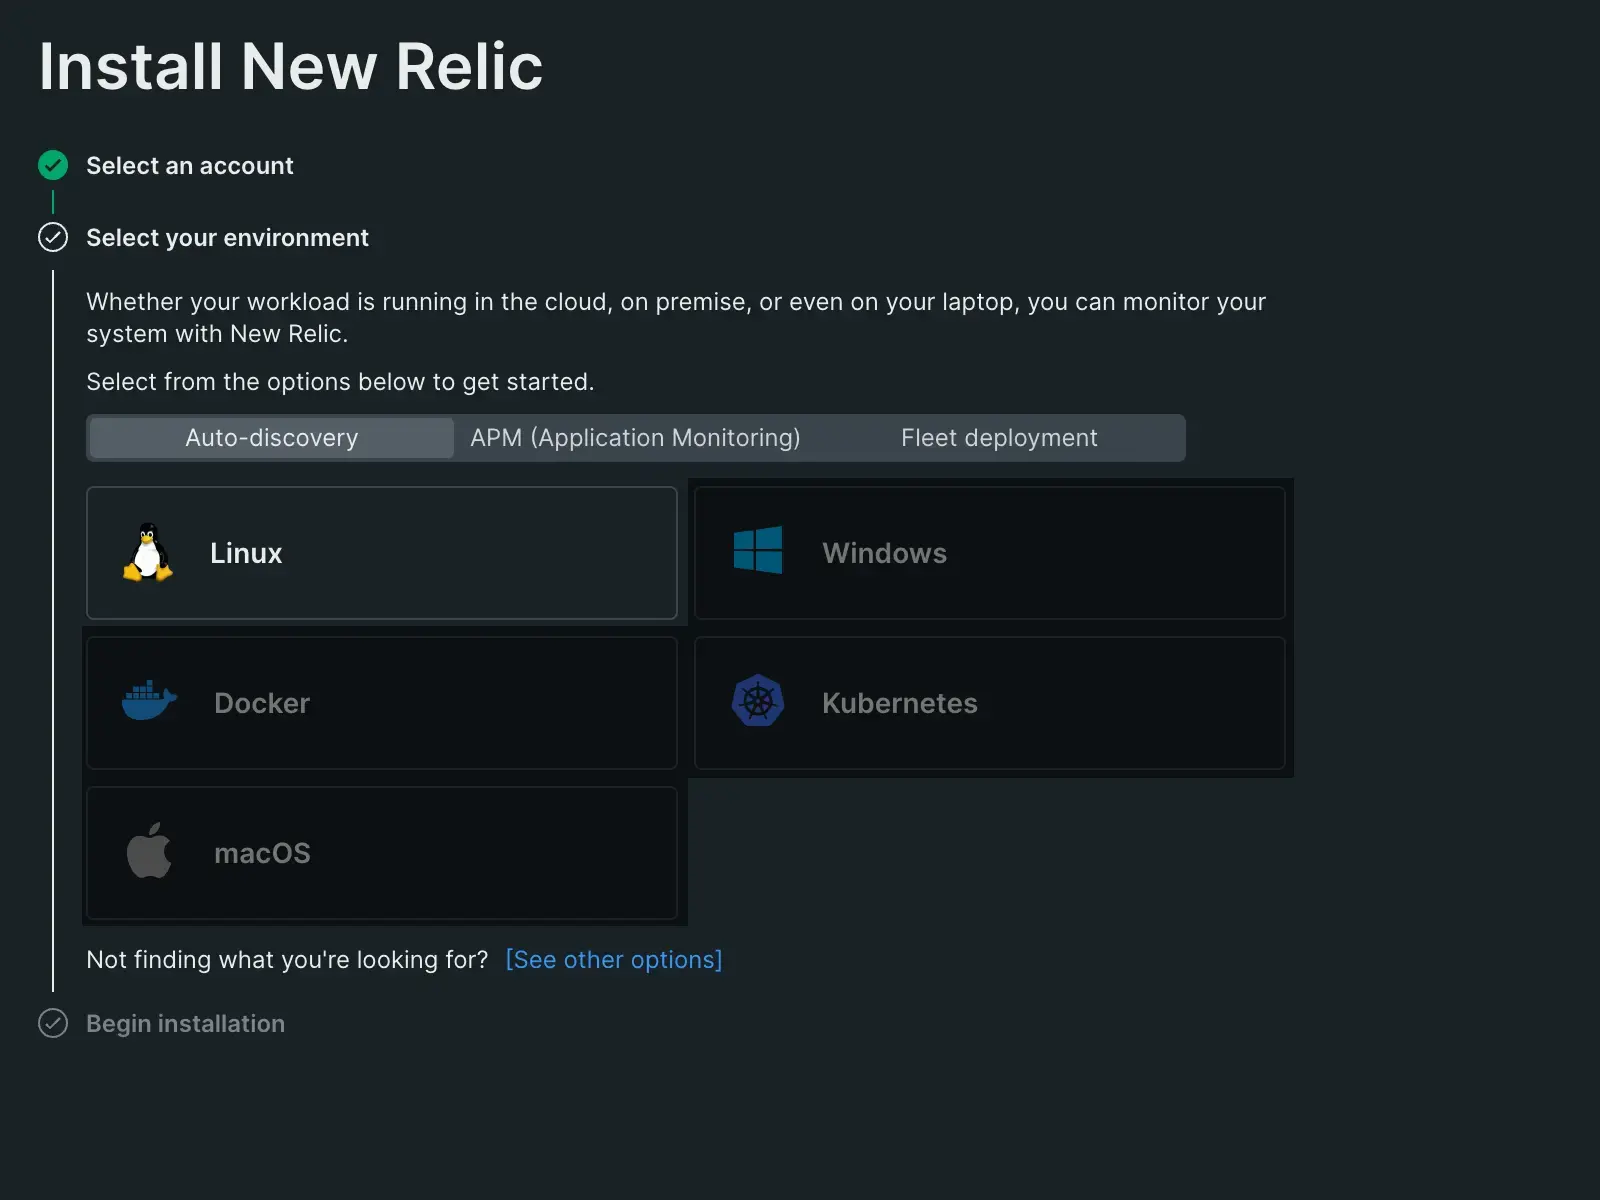
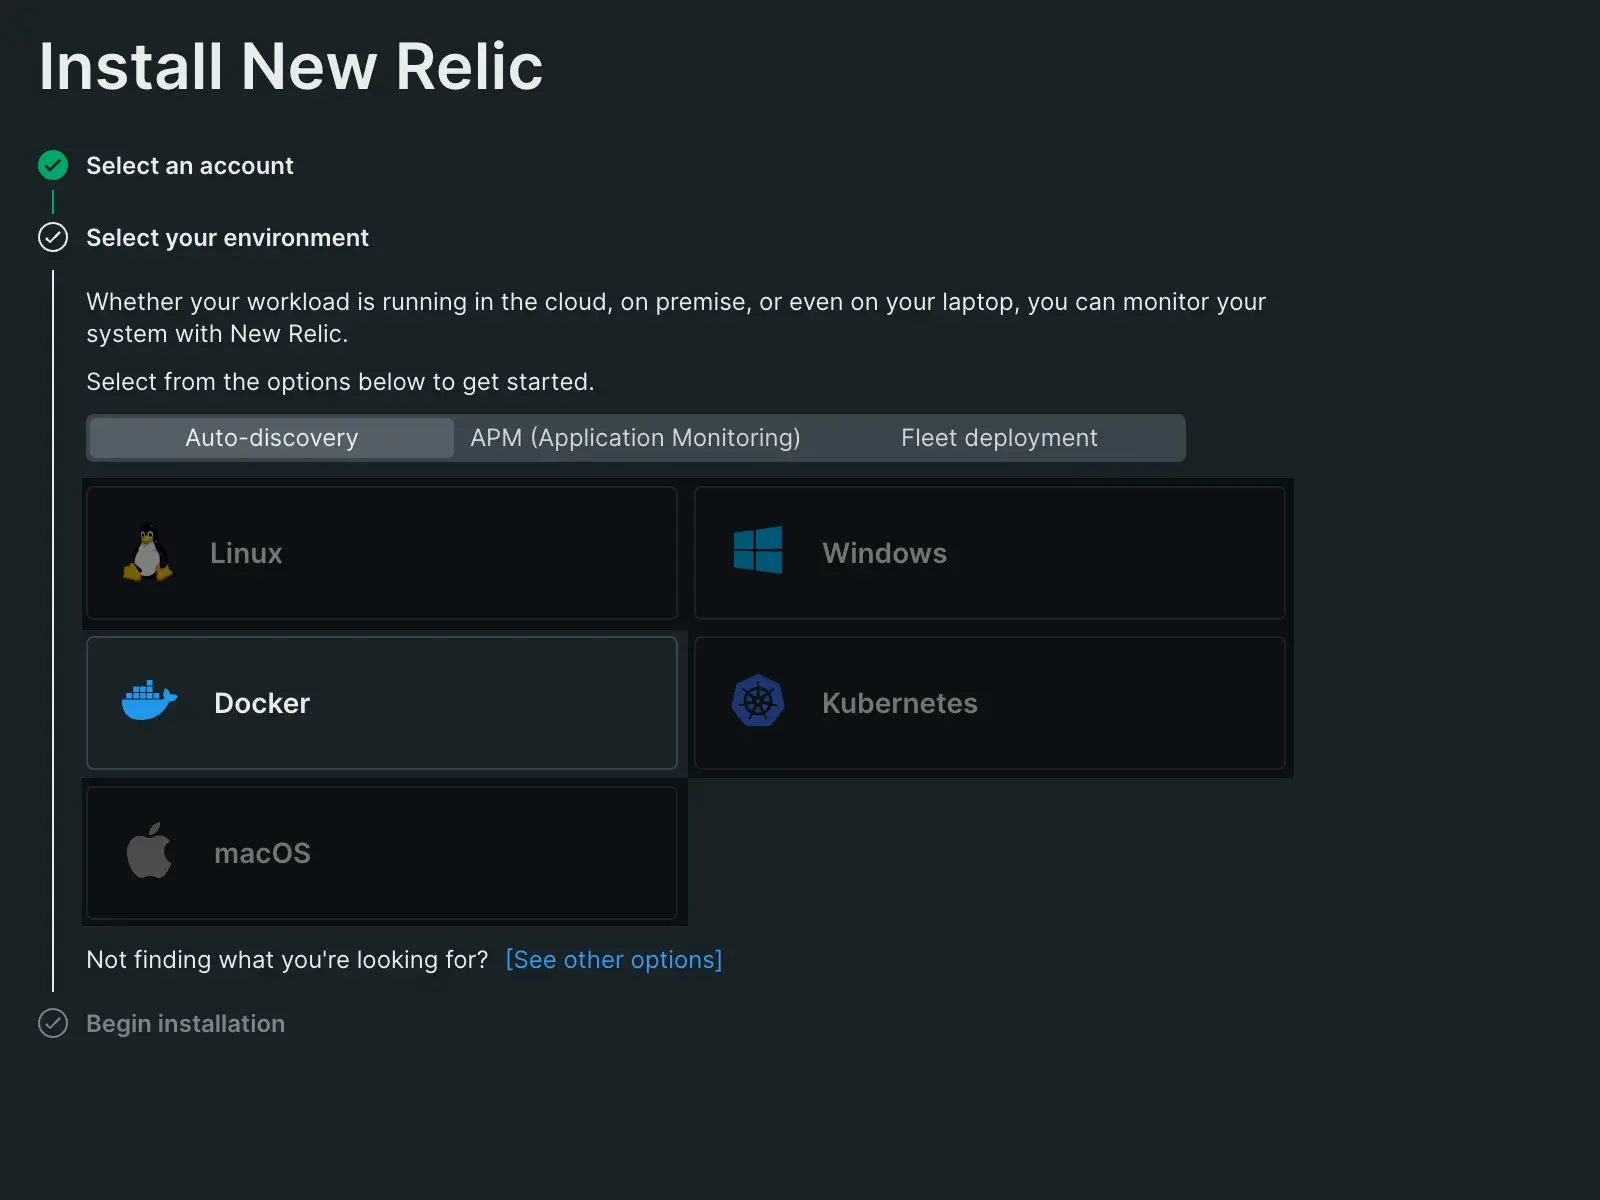
Select Linux under the Auto-discovery section.
Select Begin installation.
New Relic will provide a command for you to run on your Linux host. Just copy, paste, and run the command on your host, answer the prompts, and you're done!
Select the New Relic account you want to monitor your infrastructure data.
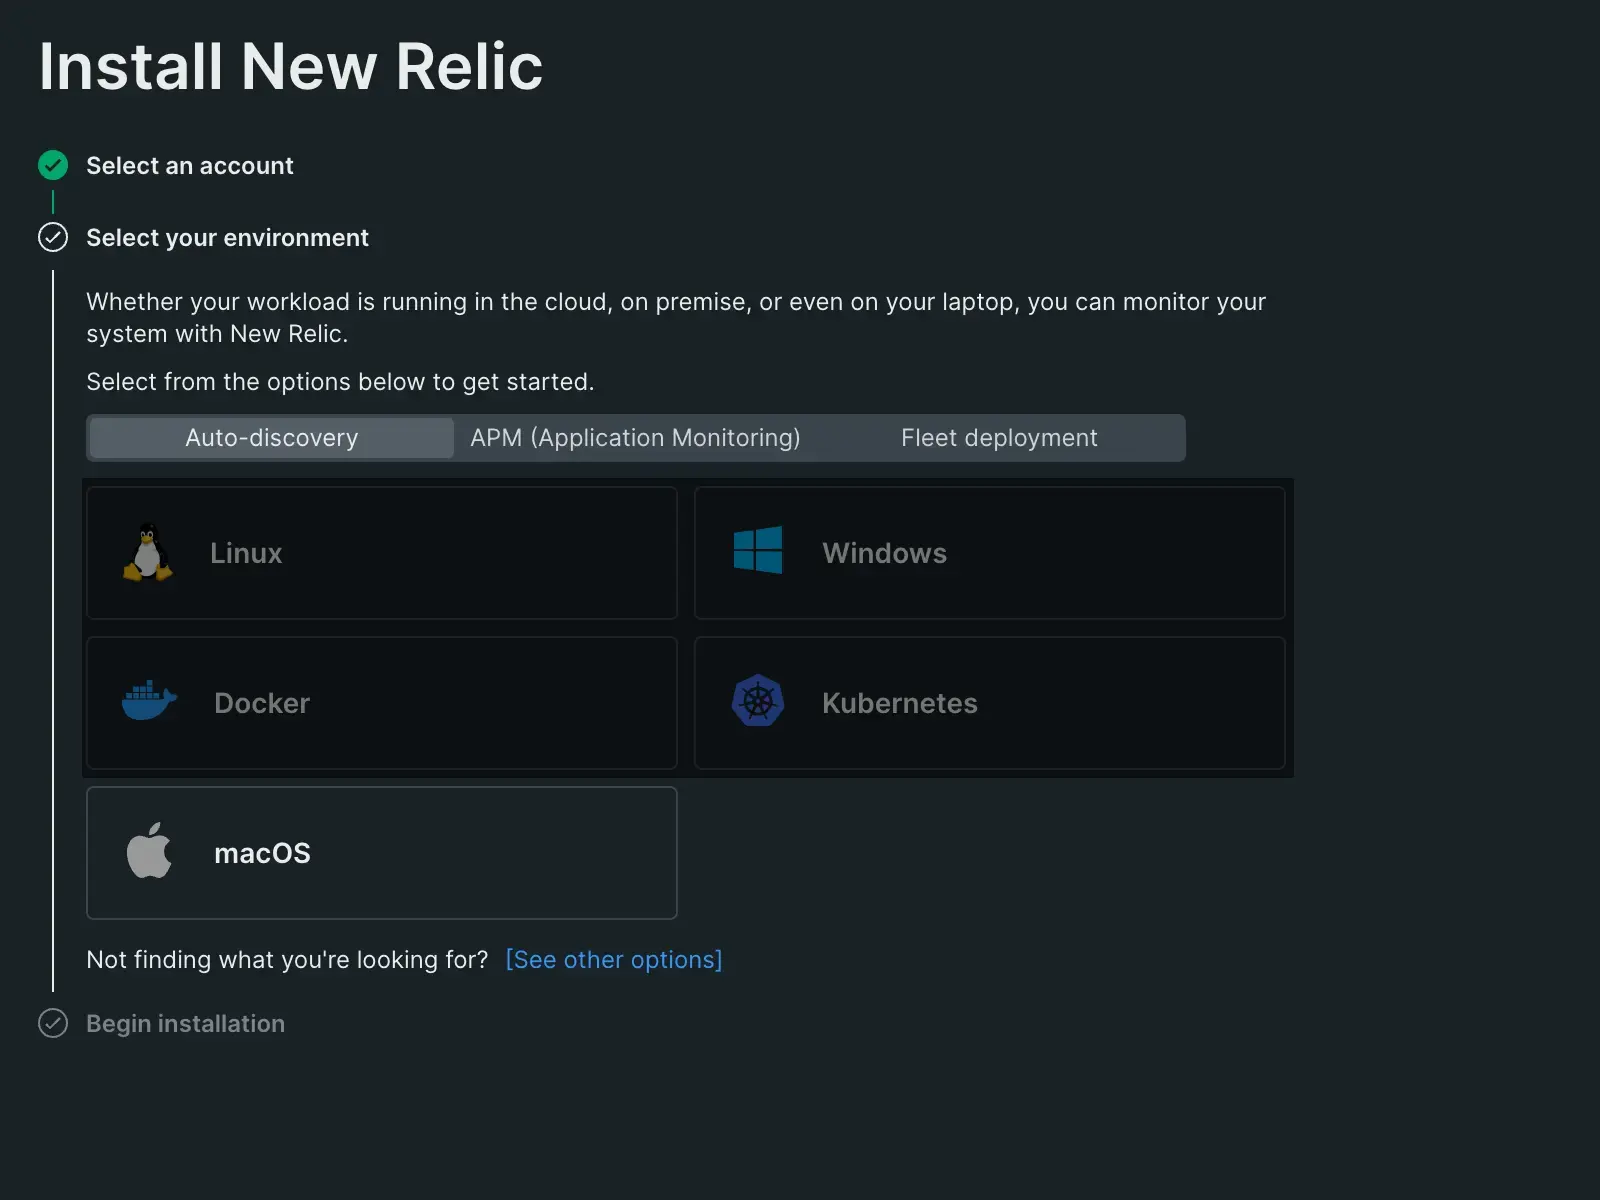
Select macOS under the Auto-discovery section.
Select Begin installation.
New Relic will provide a command for you to run on your macOS host. Just copy, paste, and run the command on your host, answer the prompts, and you're done!
Select the New Relic account you want to monitor your infrastructure data.
Select Kubernetes under the Auto-discovery section.
Select Begin installation.
The guided install will take you through the Kubernetes implementation process. Follow the prompts and you'll be all set. If you need any help, see our Kubernetes installation guide
New Relic also offers a whole suite of on-host integrations. From one.newrelic.com > Integrations & Agents > Infrastructure & OS, just select your desired integration from our list to get started.
You may be used to integrations in Datadog, but in New Relic, we call these capabilities APM agents. We've set up our agents to give you deep detail about your app's performance while still being easy to setup. At New Relic, our agents are focused around language and linking the data they collect to other entities you've installed.
For example, an installed Java agent will collect metrics about your Java app (as well as your logs, events, and traces), and links together with an installed Ruby agent which does the same for Ruby. They link up with your infrastructure agents to provide a comprehensive, real-time view of all the data across your entire system, no matter the source.
Our agents let you:
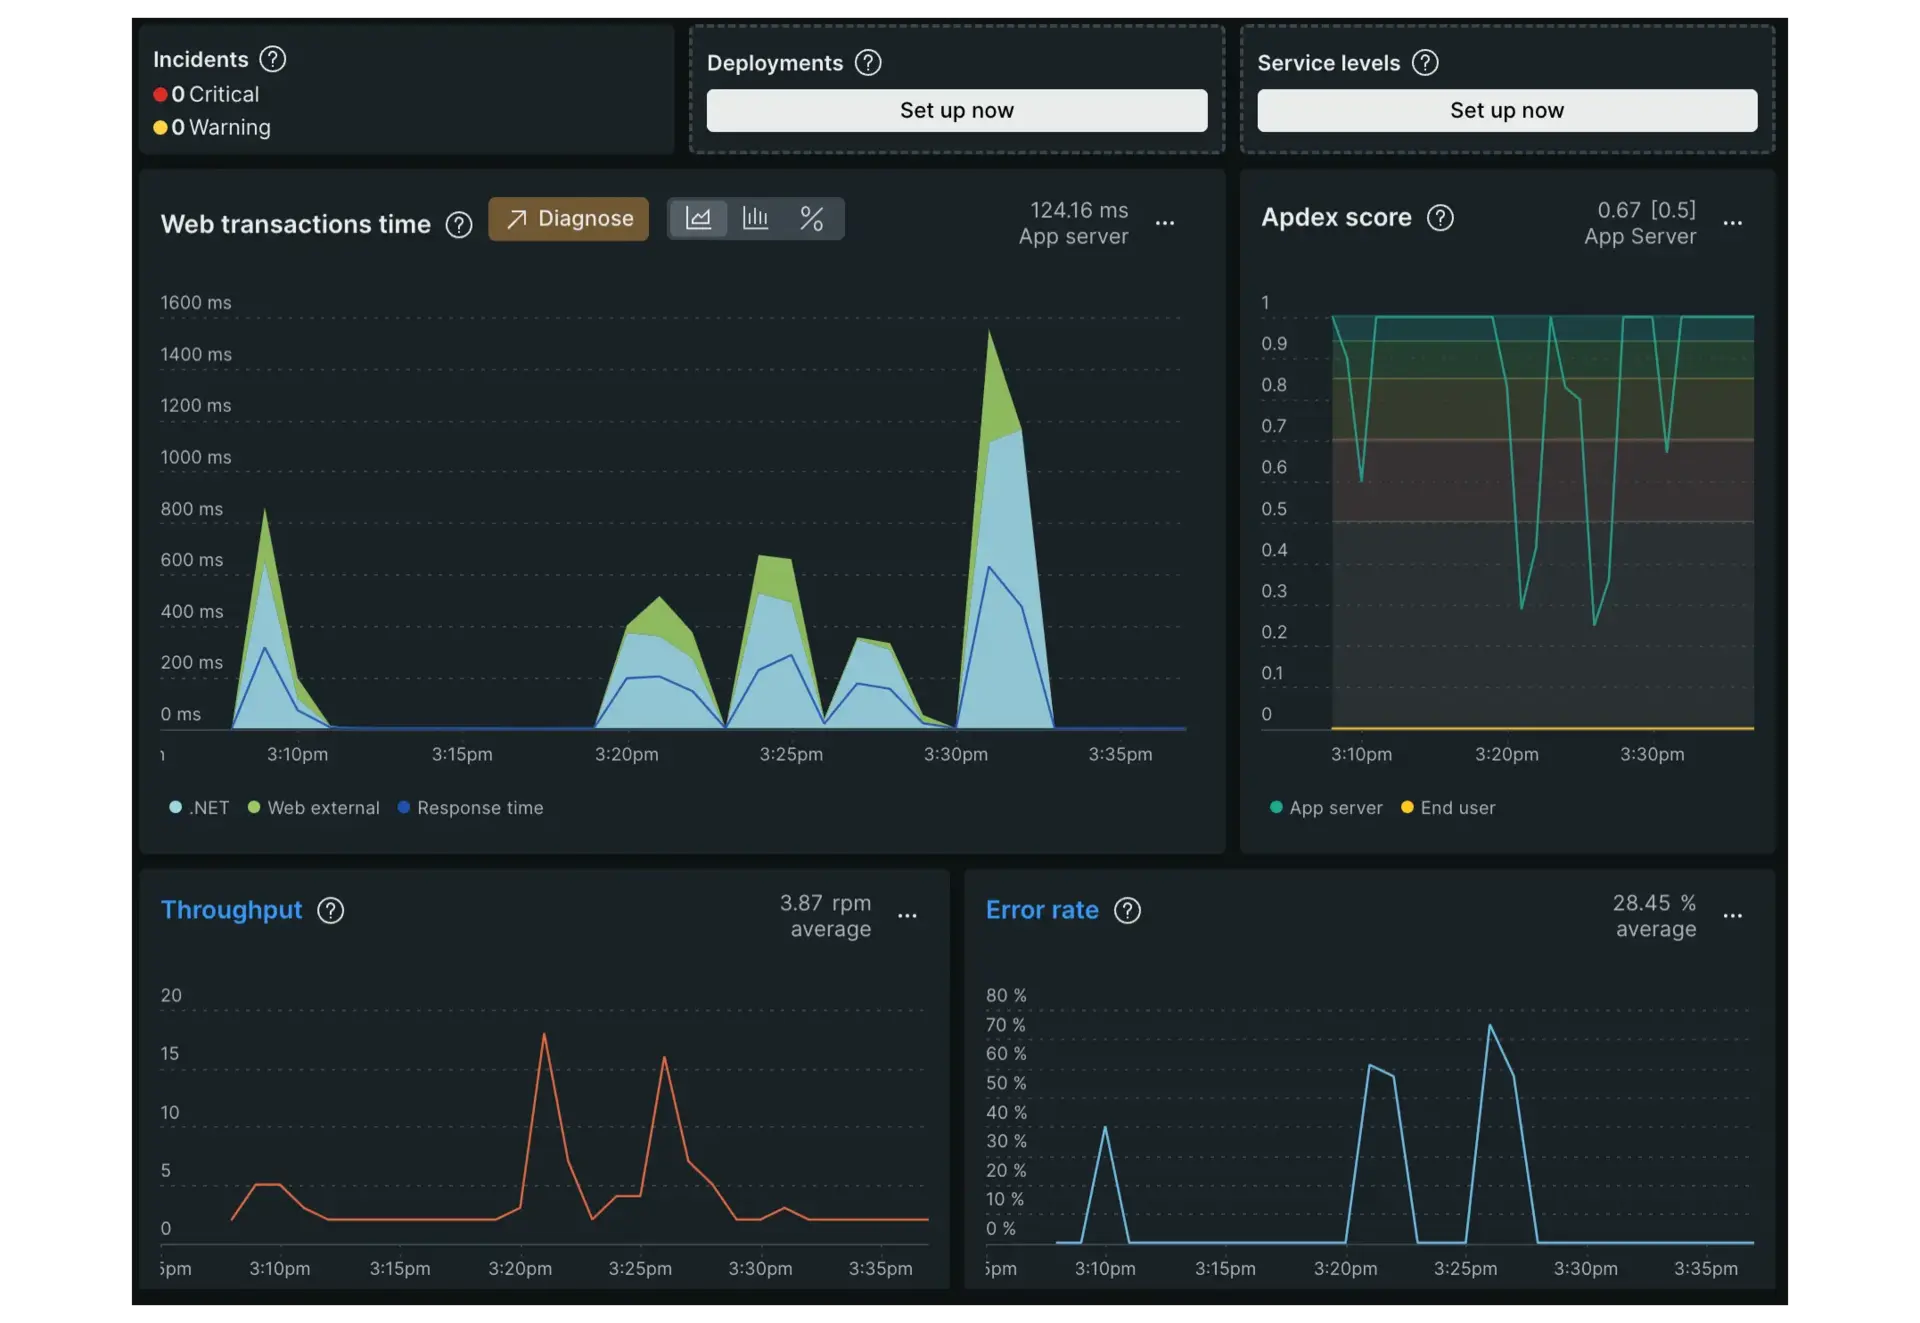
Monitor the performance and health of your apps in one central location
Use New Relic with open source tools such as OpenTelemetry
Automatically instrument metrics, events, and traces
Ingest your logs automatically
Manage service security without prior configuration
Get started with New Relic application monitoring
Once the setup is complete, your APM data in New Relic is found in the APM and services section of the UI, which is the equivalent of the APM section in Datadog. You can follow a guided install for most of our agents at any time within one.newrelic.com by selecting one.newrelic.com > Integrations & Agents > All > Guided install, then selecting your agent from the APM (Application Monitoring) section.
You can also install our APM agents directly by using any of the tiles below. Our guided install walks you through the setup procedures for any of our APM agents so that you can observe your data right away. All you need is a free account and an application to monitor and you're ready to begin!
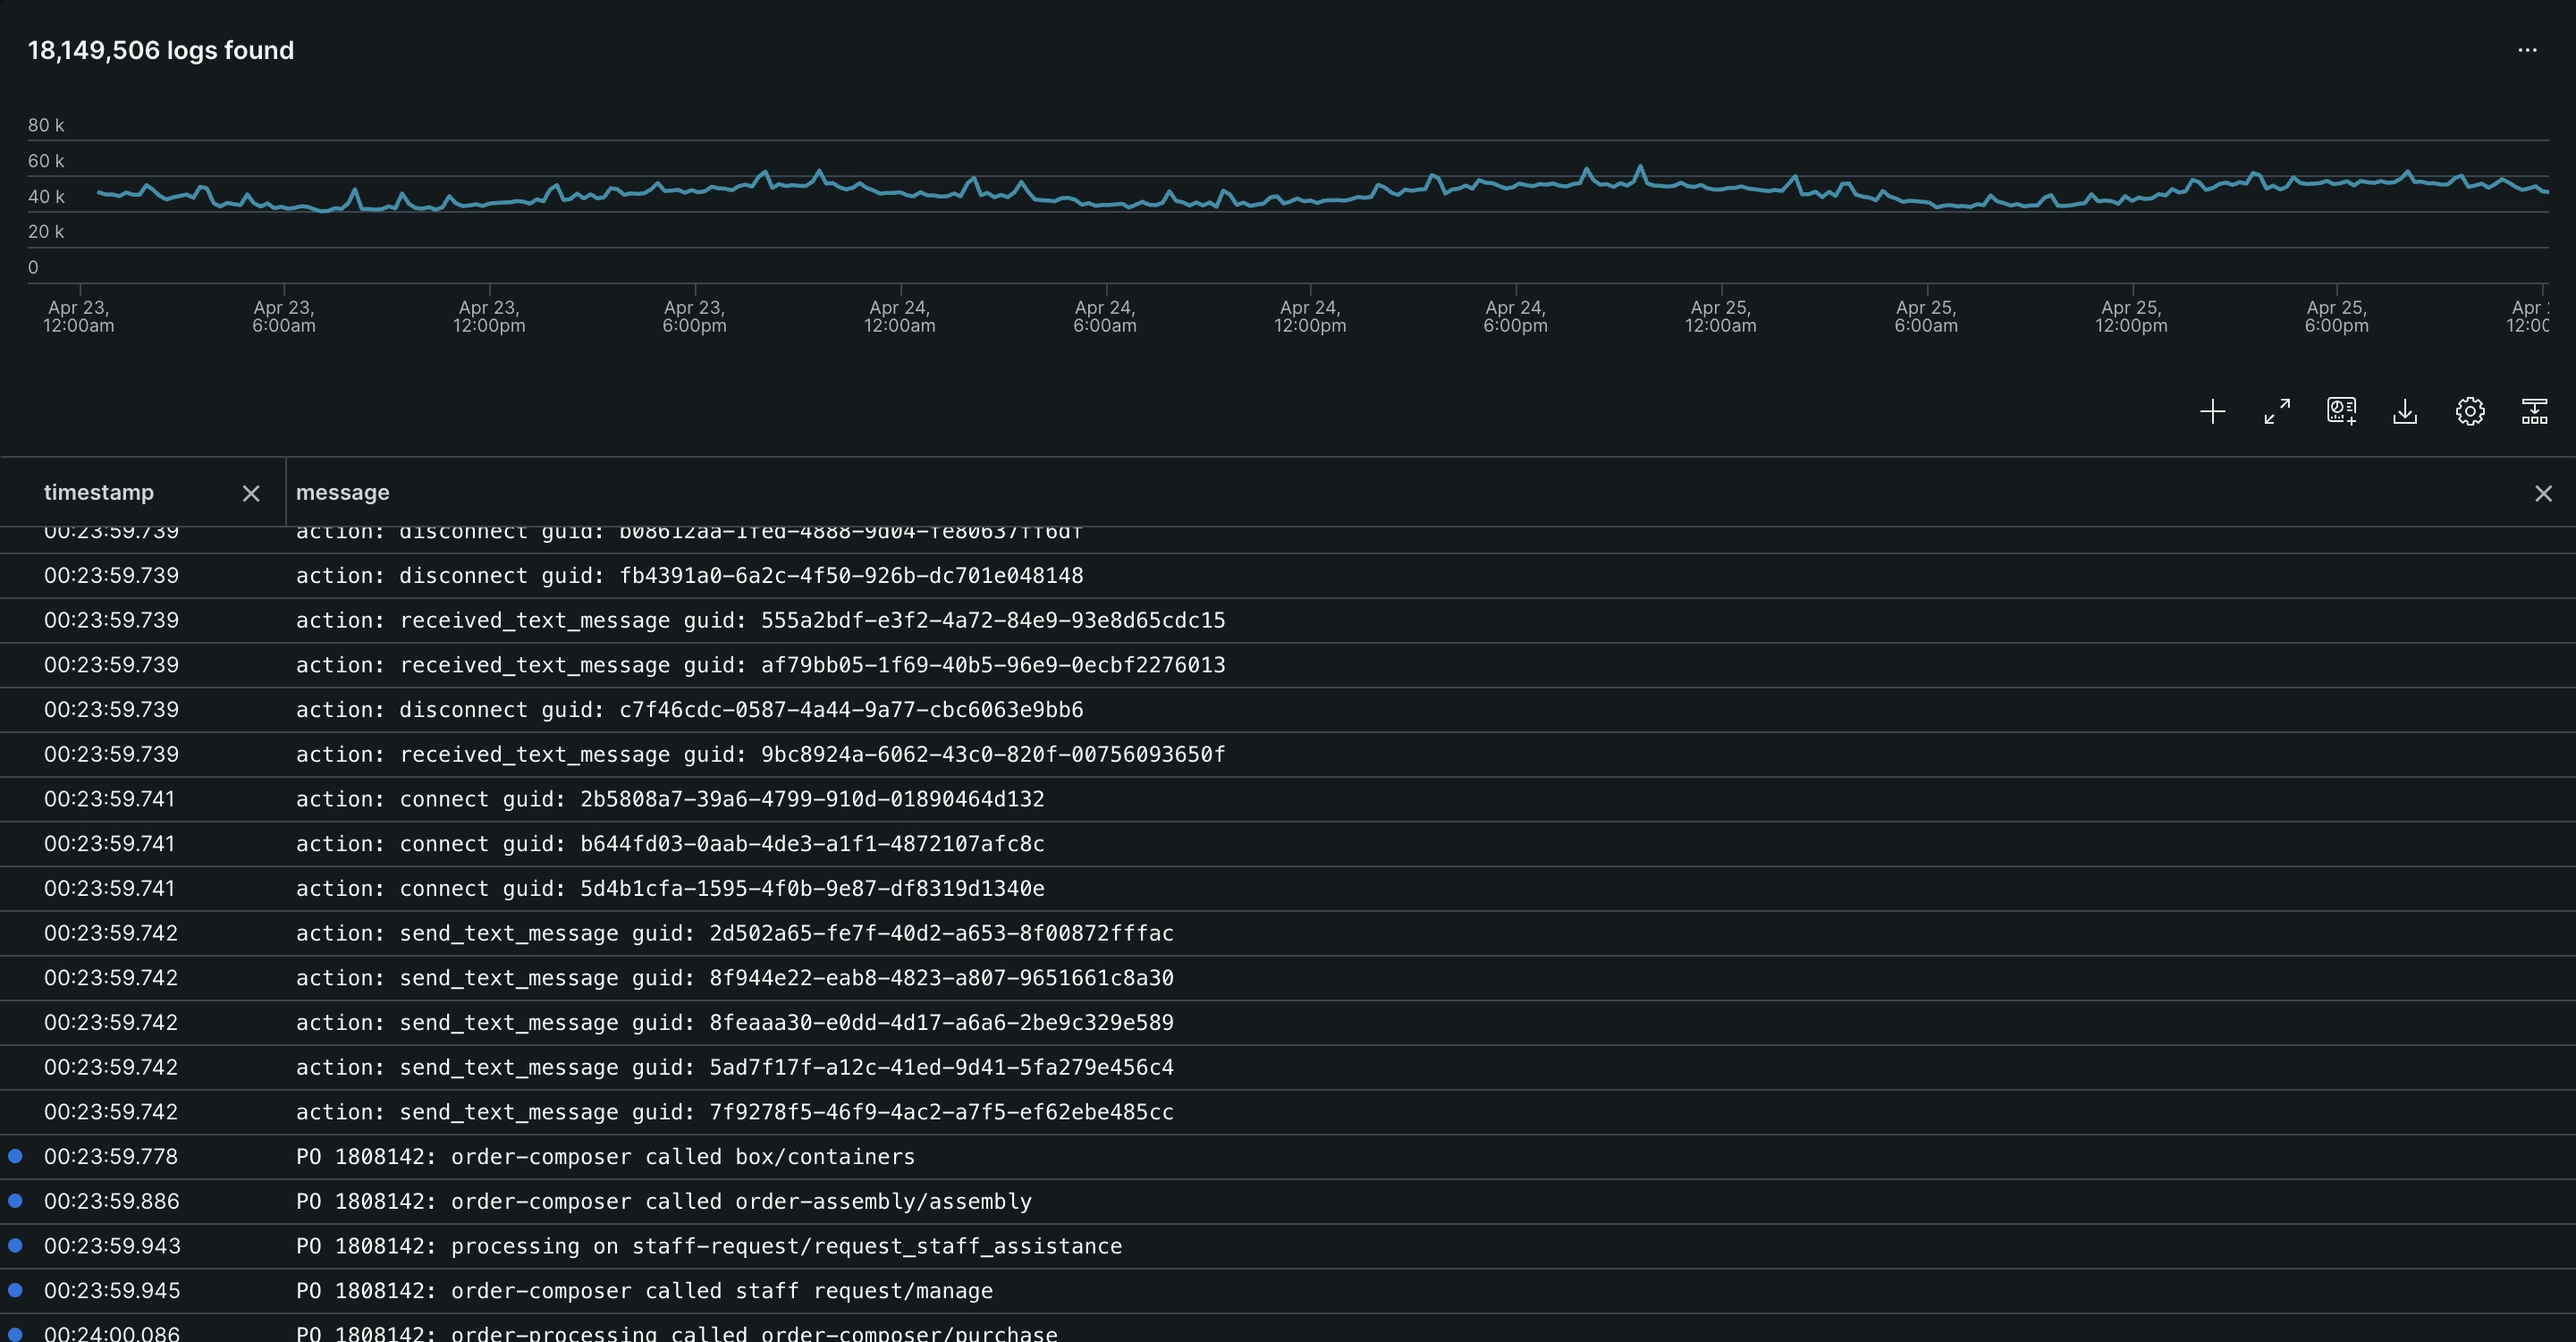
Logs in the New Relic UI are found under the Logs section. The hard part with log data is usually figuring out what matters. But it's also important to connect what's happening in your logs with the rest of your system. So we surface relevant logs in APM, infrastructure, and elsewhere to help you troubleshoot.
You can automatically pinpoint events, errors, traces, and spans among your connected entities with just a single click, keeping you in one place and getting you to what you're looking for that much faster.
Our log monitoring solution:
Enables deep visibility into your entity data, letting you see how your system works together
Helps reduce your mean time to resolution (MTTR), letting you respond to issues faster
Gives you the ability to create curated charts, dashboards, and alerts, giving you as detailed a look into your data as you want
Provides the ability to visualize, search, and troubleshoot performance issues in one central location without the need to switch between tools
Get started with New Relic log monitoring
Once installed, your log monitoring is done in the Logs section of the UI, exactly like it is in Datadog. You can use our guided installations for logs after setting up any of our infrastructure or APM agents.
The steps for setting up logs varies depending on the data source, but no matter which you choose, you can rest assured knowing we'll guide you through every step of the process to make it as easy and straightforward as possible. You can see our list of guided installations for logs by selecting one.newrelic.com > Integrations & Agents > Logging in the New Relic UI.
Explore premade dashboards
Once your data ingestion is set up, you'll want to use our dashboards to begin observing it. You can set dashboards up yourself by checking out this doc, or you can learn about any of our premade options listed below. Just choose the option below based on what data agent you installed above to learn more.
Add alerts
For more on creating alerts, see our alert conditions doc.
