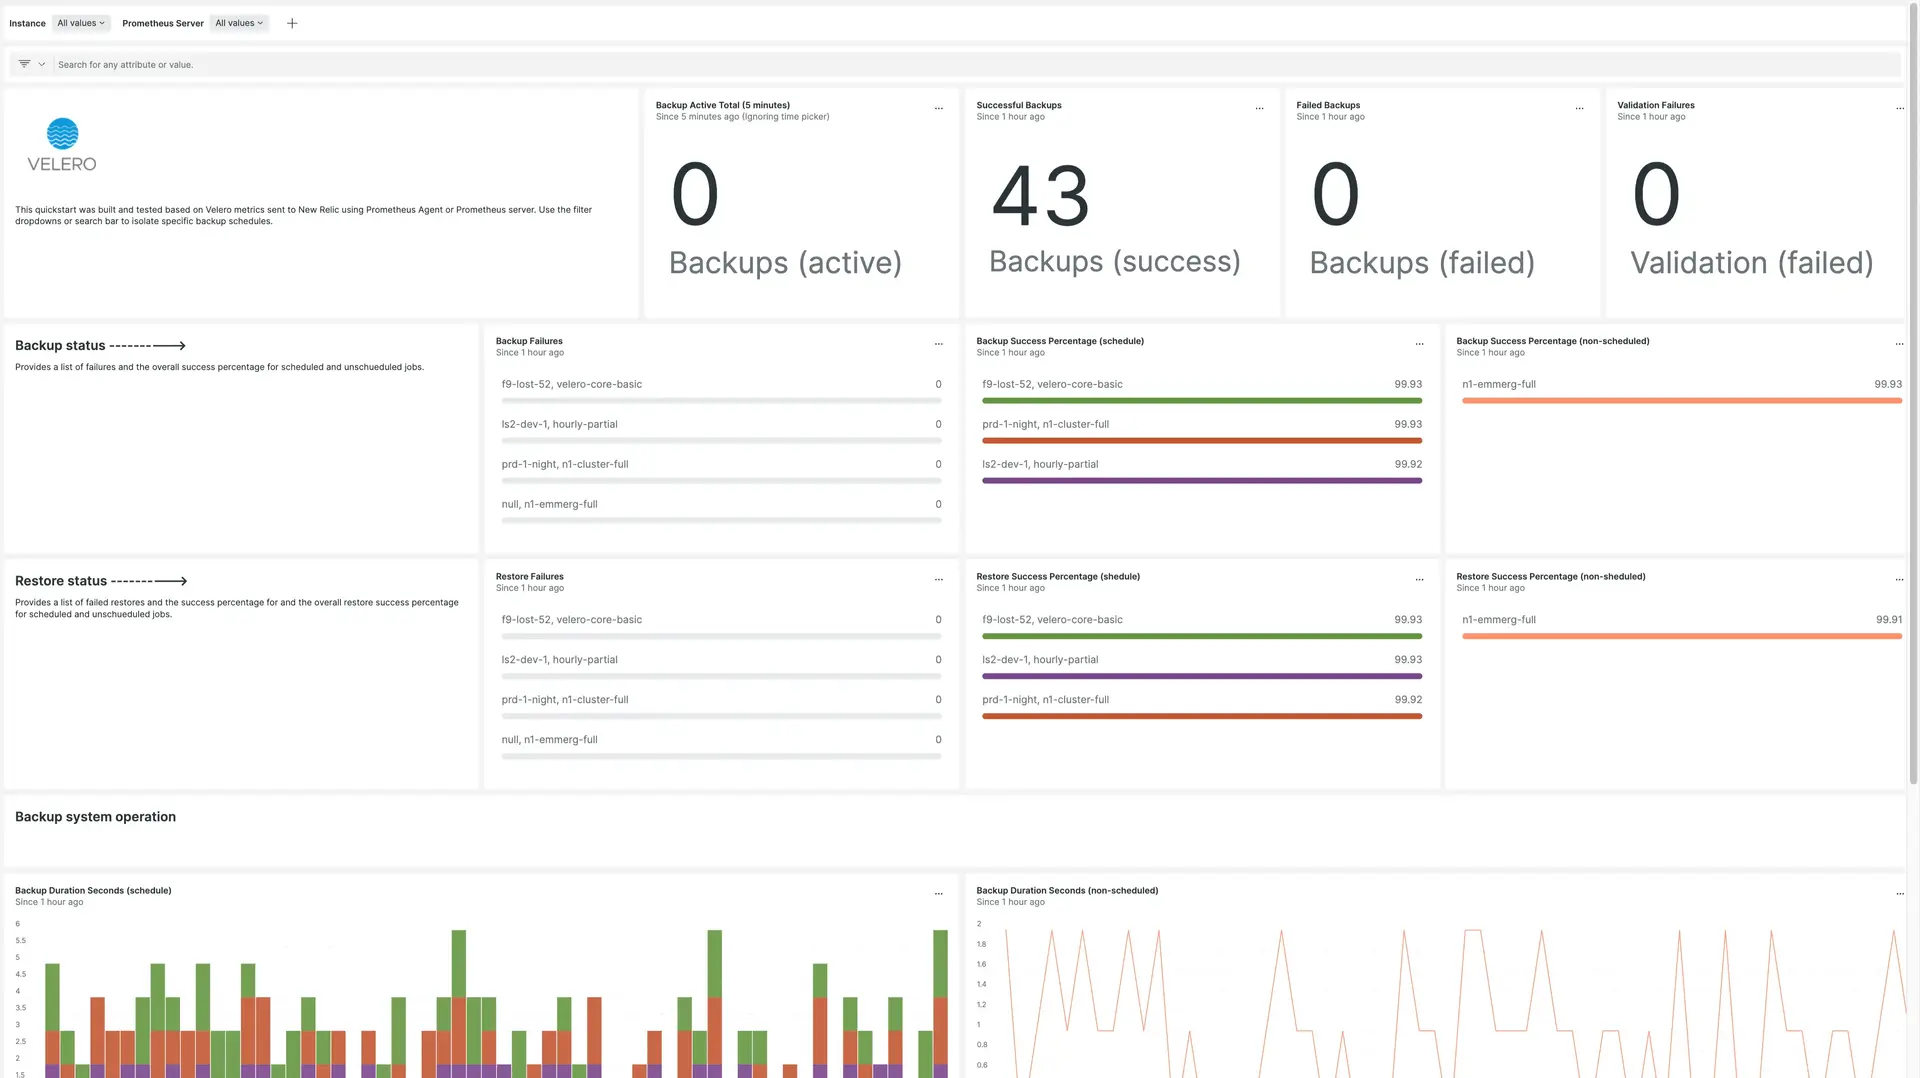
Velero is an open-source tool for safely backing up and restoring resources in a Kubernetes cluster, performing disaster recovery, and migrating resources and persistent volumes to another Kubernetes cluster.
Use New Relic to understand the success and performance of your Velero backup jobs for your k8s cluster. With New Relic you can monitor:
- Backup status by instance
- Backup durations and size by instance
- Restore status by instance

Enable the integration
Follow these steps to enable the integration.
Follow the Velero documentation for Prometheus to discover the Velero metrics endpoints.
Set up Prometheus monitoring. Prometheus metrics needs to be integrated with New Relic, you can use the Prometheus Agent or the Remote Write integration. See how to send Prometheus metrics for more details.
Important
The Prometheus Agent only scrapes metrics by default from a set of integrations.
In this case, you must identify your pod or endpoint with one of the these labels
app.kubernetes.io/name,app.newrelic.io/name,k8s-appcontaining the stringvelero.Use the following query to confirm metrics are being ingested as expected:
FROM Metric SELECT count(*) WHERE metricName LIKE 'velero_%' FACET metricName LIMIT MAXInstall the Velero quickstart to access built-in and alerts.
Once you imported, you can edit or clone the assets to adapt them to your specific requirements.
Find and use metrics
Prometheus metrics are stored as dimensional metrics. You can query using NRQL or use the Data Explorer to browse the available metrics, facet, and filter by the associated dimensions.
Use the following NRQL queries to understand the metrics being ingested in New Relic:
List unique metric names:
FROM Metric SELECT uniques(metricName) WHERE metricName LIKE 'velero_%' LIMIT MAXCount number of metric updates:
FROM Metric SELECT datapointcount() WHERE metricName LIKE 'velero_%' LIMIT MAXEstimate data ingestion (daily ingest, in bytes):
FROM Metric SELECT bytecountestimate() WHERE metricName LIKE 'velero_%' SINCE 1 day ago
Troubleshooting
Use this command to verify that the Velero Prometheus endpoint is emitting metrics on any k8s node configured with Velero:
bash$curl <Velero-Pod-IP>:8085/metricsFollow the troubleshooting tips from Velero documentation to make sure that metrics are configured as expected on your cluster.
You can also check the specific troubleshooting guidelines for Prometheus integrations.