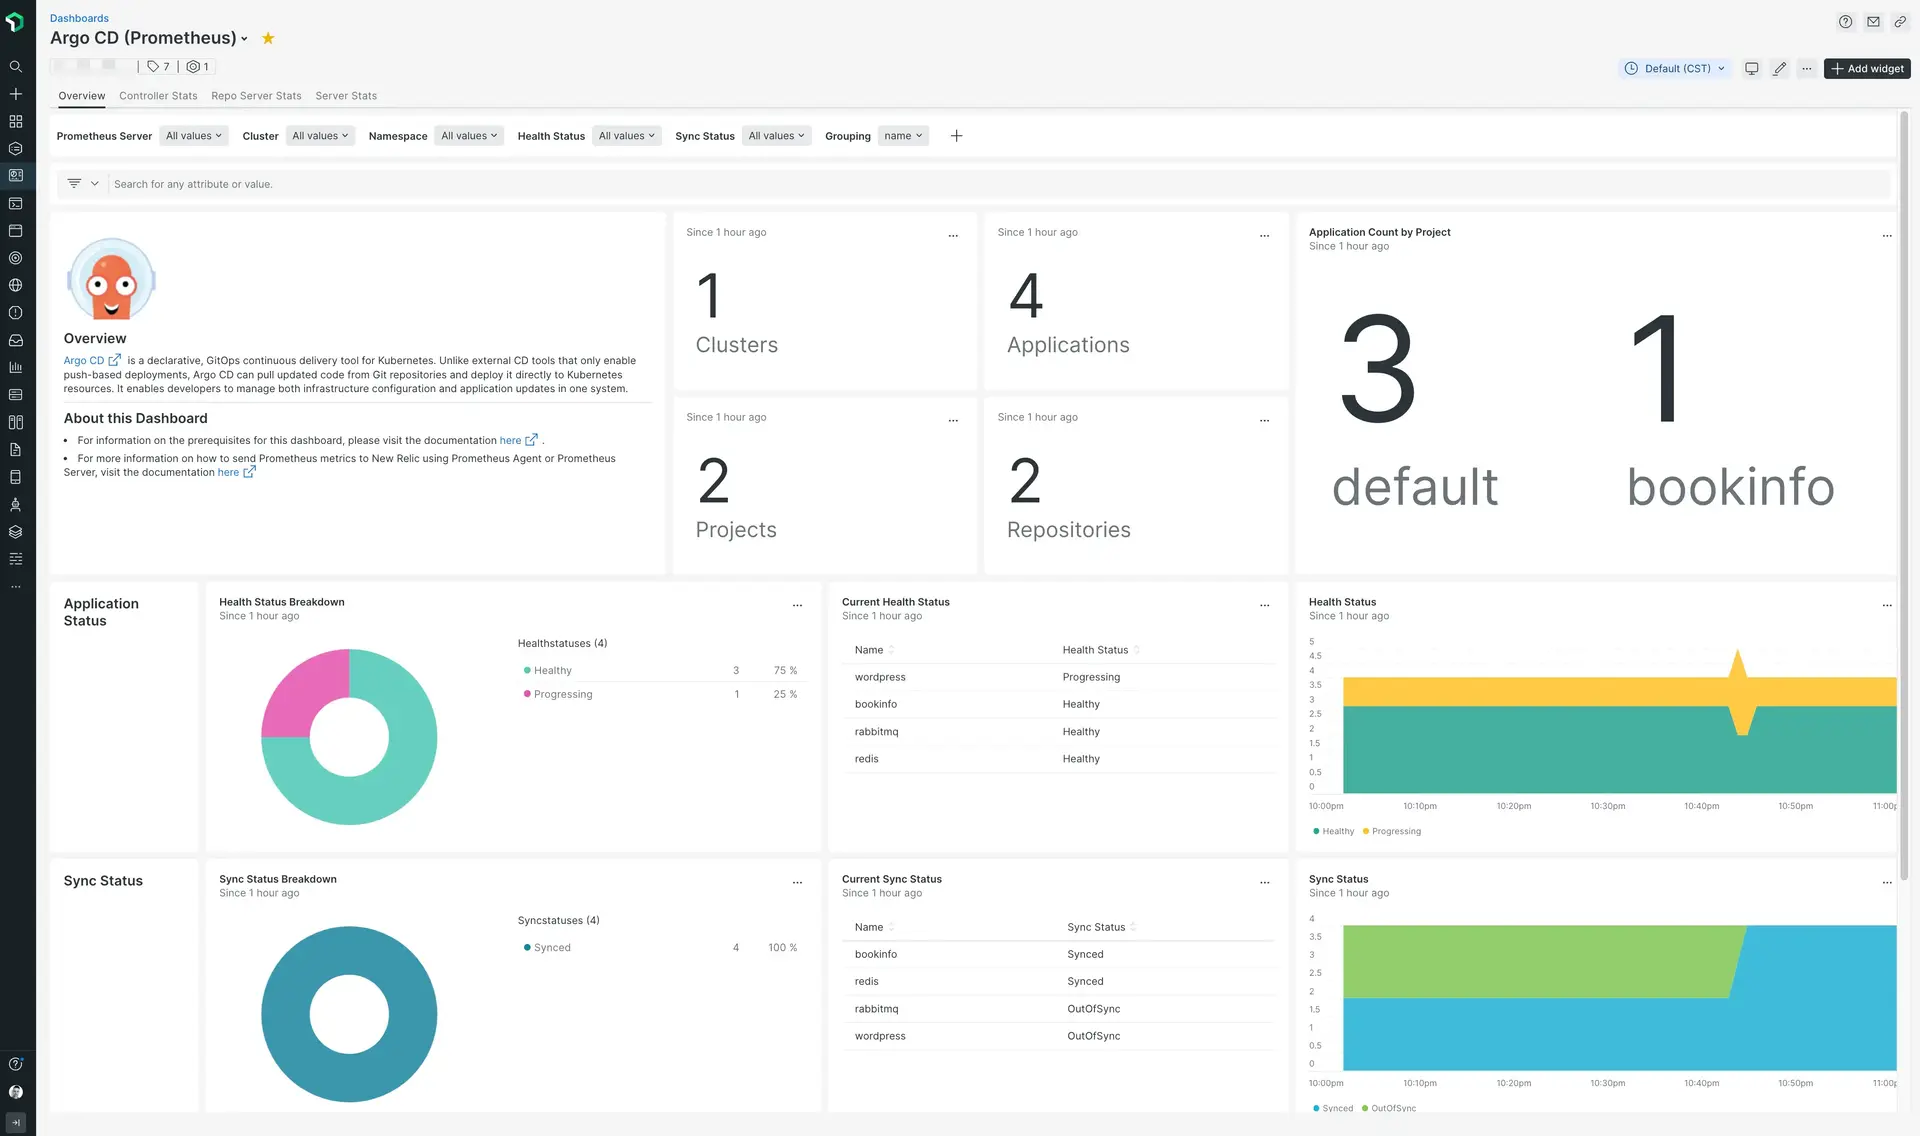
Argo CD is a Kubernetes controller, responsible for continuously monitoring all running applications and comparing their live state to the desired state specified in the Git repository.
Use New Relic to view a dashboard based on Prometheus metrics to better understand the Argo CD infrastructure of your k8s cluster. With New Relic you can monitor:
- Application health status
- Application sync status
- Argo CD Controller stats
- Argo CD Server stats
- Repository stats

Enable the integration
Follow these steps to enable the integration.
Follow the Argo CD documentation to learn more about the metrics exposed by Argo CD.
Set up Prometheus monitoring. Prometheus metrics need to be integrated with New Relic. You can use the Prometheus Agent for Kubernetes or the Prometheus Remote Write integration. See how to send Prometheus metrics for more details.
Important
The Prometheus Agent only scrapes metrics by default from a set of integrations.
In this case, you must identify your pod or endpoint with one of the these labels
app.kubernetes.io/name,app.newrelic.io/name,k8s-appcontaining the stringargocd.Use the following query to confirm metrics are being ingested as expected:
FROM Metric SELECT count(*) WHERE instrumentation.name = 'remote-write' AND metricName LIKE 'argocd_%' FACET metricName LIMIT MAXInstall the Argo CD quickstart to access built-in and alerts.
Once you imported, you can edit or clone the assets to adapt them to your specific requirements.
Important
Some charts of the dashboard include queries with conditions that require the identification of your pod or endpoint with one of the these labels
app.kubernetes.io/name,app.newrelic.io/name,k8s-appcontaining the stringargocd.
Find and use metrics
Prometheus metrics are stored as dimensional metrics. You can query using NRQL or use the Data Explorer to browse the available metrics, facet, and filter by the associated dimensions.
The different sets of metrics exposed by this integration are defined in the Argo CD documentation.
Use the following NRQL queries to understand the metrics being ingested in New Relic:
List unique metric names:
FROM Metric SELECT uniques(metricName) WHERE instrumentation.name = 'remote-write' AND metricName LIKE 'argocd_%' LIMIT MAXData points per minute:
FROM Metric SELECT rate(datapointcount(), 1 minute) WHERE instrumentation.name = 'remote-write' AND metricName LIKE 'argocd_%' LIMIT MAXEstimate data ingestion (daily ingest, in bytes):
FROM Metric SELECT bytecountestimate() WHERE instrumentation.name = 'remote-write' AND metricName LIKE 'argocd_%' SINCE 1 day ago
Troubleshooting
Use this command to verify that the Argo CD Prometheus endpoint is emitting metrics on any K8s node configured with Argo CD:
bash$curl <Argo CD-Pod-IP>:8082/metricsYou can also check the specific troubleshooting guidelines for Prometheus integrations.