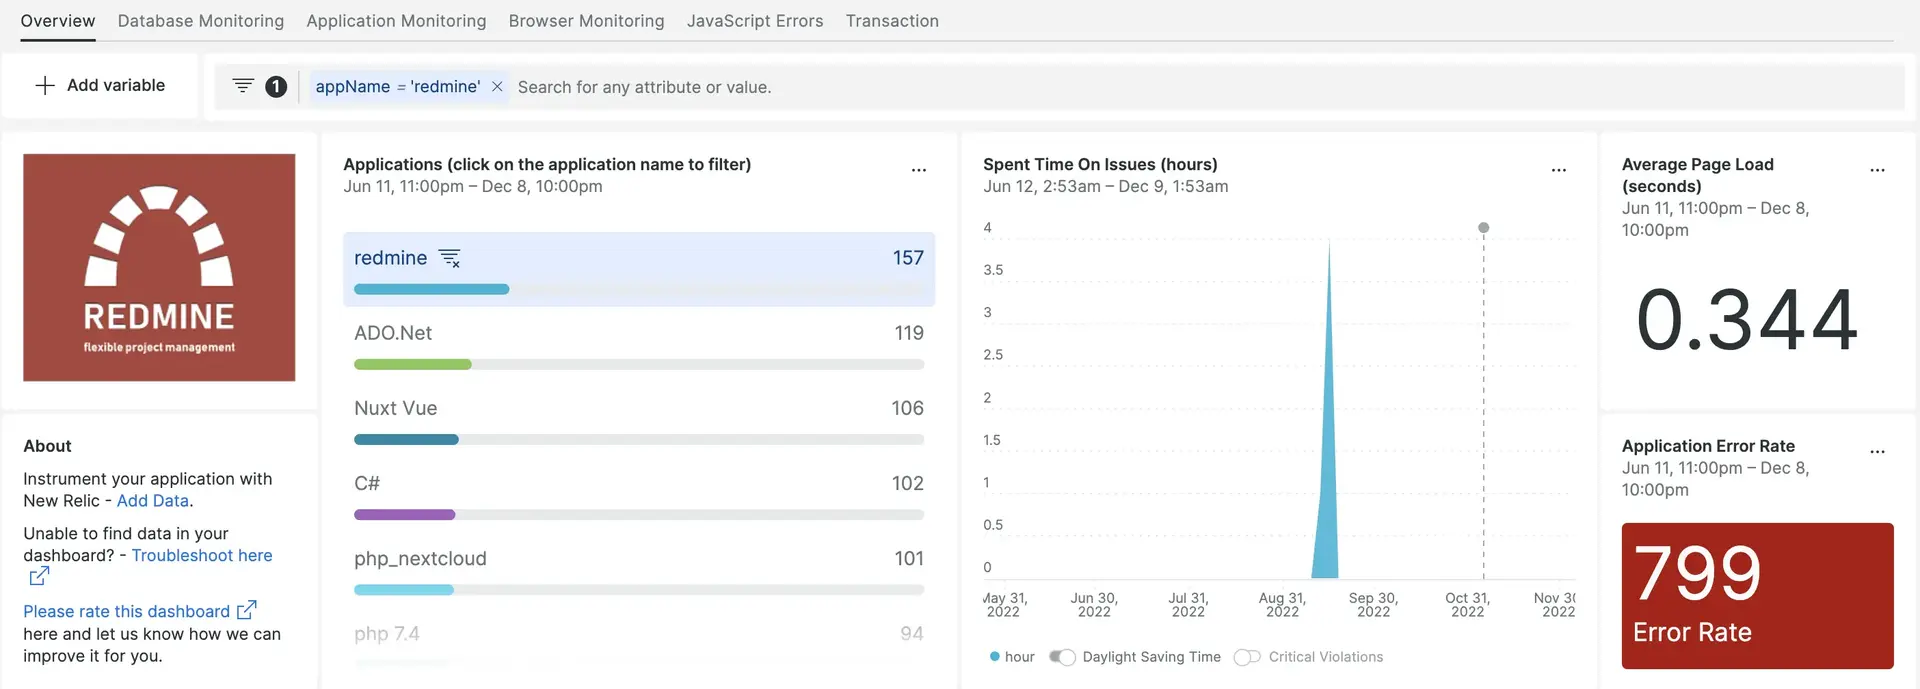
With our Redmine dashboard, you can easily track your web transaction rate, application error rate, and databases. Built with our Ruby agent, the Redmine quickstart gives you a set of default that let you view your most critical data all in one place.

After setting up the integration with New Relic, see your data in dashboards like these, right out of the box.
Integrate Redmine with the the Ruby agent
Our Ruby agent collects and ingests data so you can track your Redmine performance in New Relic. You can install the Ruby agent using our launcher, or by following manual installation with our docs.
Once installed, confirm that New Relic is ingesting your Redmine data by going to one.newrelic.com, then clicking Metrics & events. Run the following NRQL query to confirm that New Relic is receiving Redmine data:
SELECT apm.service.transaction.duration FROM MetricInstall the infrastructure agent
While our Redmine integration isn't built with our infrastructure agent, we recommend installing it if you want performance data about your hosts. You can install the infrastructure agent in two different ways:
Our guided install is a CLI tool that inspects your system and installs the infrastructure agent alongside the application monitoring agent that best works for your system. To learn more about how our guided install works, check out our Guided install overview.
If you’d rather install our infrastructure agent manually, you can follow a tutorial for manual installation for Linux, Windows, or macOS.
See Redmine metrics in a dashboard
Our default dashboard transform that raw data into charts and graphs, which provide a bird’s eye view of your system’s health. To install our default dashboards, go to our Redmine instant observability page.
Create queries for customized dashboards
Certain performance metrics aren't available out of the box with our pre-built dashboards. While optional, we recommend additional instrumentation so you can track Redmine metrics such as manageable, unmanageable, and overdue issues. To start tracking, install the Monitoring & Controlling plugin for your Redmine application.
Go to your
redmine-monitoring-controllingfolder and open the file namedhome_monitoring_controlling_project_controller.rb. This is found in your plugins directory.Insert this snippet at the bottom of the file:
::NewRelic::Agent.record_metric(‘Custom/managementIssues’,@managementissues.count)Go to one.newrelic.com, then click Metrics & events. Run the following query to confirm that New Relic is reporting custom metrics:
SELECT MAX(newrelic.timeslice.value) AS Manageable Issues FROM Metric WHERE metricTimesliceName like '%Custom/managementissues%'
What's next?
To learn more about building NRQL queries and generating dashboards, check out these docs:
- Introduction to the query builder to create basic and advanced queries.
- Introduction to dashboards to customize your dashboard and carry out different actions.
- Manage your dashboard to adjust your dashboards display mode, or to add more content to your dashboard.