Core Web Vitals (CWV) are Google’s metrics that gauge overall user experience. They give valuable insight into how users view your business, which can influence your site’s SEO rankings. By having a score that captures user experience, you can take action on specific problems rather than guessing at what your site needs.
Objectives
This tutorial walks you through using New Relic to break down your CWV. By the end of the tutorial, you'll have these tasks completed:
- Find CWV in New Relic.
- Understand how CWV translates into site performance.
- Explore your New Relic data to identify what's contributing to your score.
Learn about CWV
Google measures overall website performance by these three metrics:
Largest contentful paint (LCP): how long it takes for the main content of a page to load. For example, a user who lands on a webpage with a slow LCP might see a blank screen for several seconds before the content appears.
Interaction to next paint (INP): How long it takes for a page to respond to a user's interaction. For example, if a user clicks a button, INP measures how long it takes between the click and the next page opening. A high INP reflects a sluggish and unresponsive webpage experience, hindering user engagement.
Cumulative layout shift (CLS): How often unexpected layout shifts occur on a page while loading. For example, a user who's about to click a button might find the content jumps to a new place on the screen, which could cause them to click something else accidentally. A high CLS can make a webpage feel clunky and difficult to interact with.
Each web vital has the following thresholds to help you track your app's performance and SEO:
Good | Needs improvement | Poor | |
|---|---|---|---|
Largest contentful paint | 2.5 seconds or less | Between 2.5 seconds and 4 seconds | Longer than 4 seconds |
Interaction to next paint | Less than 200 milliseconds | Between 200 and 500 milliseconds | Longer than 500 milliseconds |
Cumulative layout shift | Below 0.1 | Between 0.1 and 0.25 | Above 0.25 |
Tip
How is the CLS score calculated?
The cumulative layout shift score is a unitless value between 0 and infinity, not a time-based measurement like the other CWVs. It reflects the sum of the impact of unexpected layout shifts that occur during the loading process of a webpage. Here's how the CLS score is calculated:
- Layout shift score: This considers two factors:
- Fraction of viewport shifted: How much of the visible area of the page (viewport) is affected by the layout shift.
- Distance the content moved: How far the elements that moved are displaced from their original position.
- Multiple layout shifts: The CLS score considers all the layout shifts that happen within a short timeframe (session window). The largest session window's score is the final CLS value.
Good web vitals can help your organization save money and increase SEO. Poor or Needs improvement can reflect negative user perceptions of your organization, which could result in dissatisfied customers or lost business opportunities.
New Relic leverages Google's web-vitals API library to gather web vitals in their raw state, without introducing additional calculations. To learn more about why CWVs matter and how they're calculated, see the web.dev article User-centric performance metrics.
Find CWVs in New Relic
CWVs are embedded into many New Relic features, but the best way to view web vitals at a high level is:
Go to one.newrelic.com > All capabilities > Browser.
Select an app.
From the left-hand menu, click Web vitals.
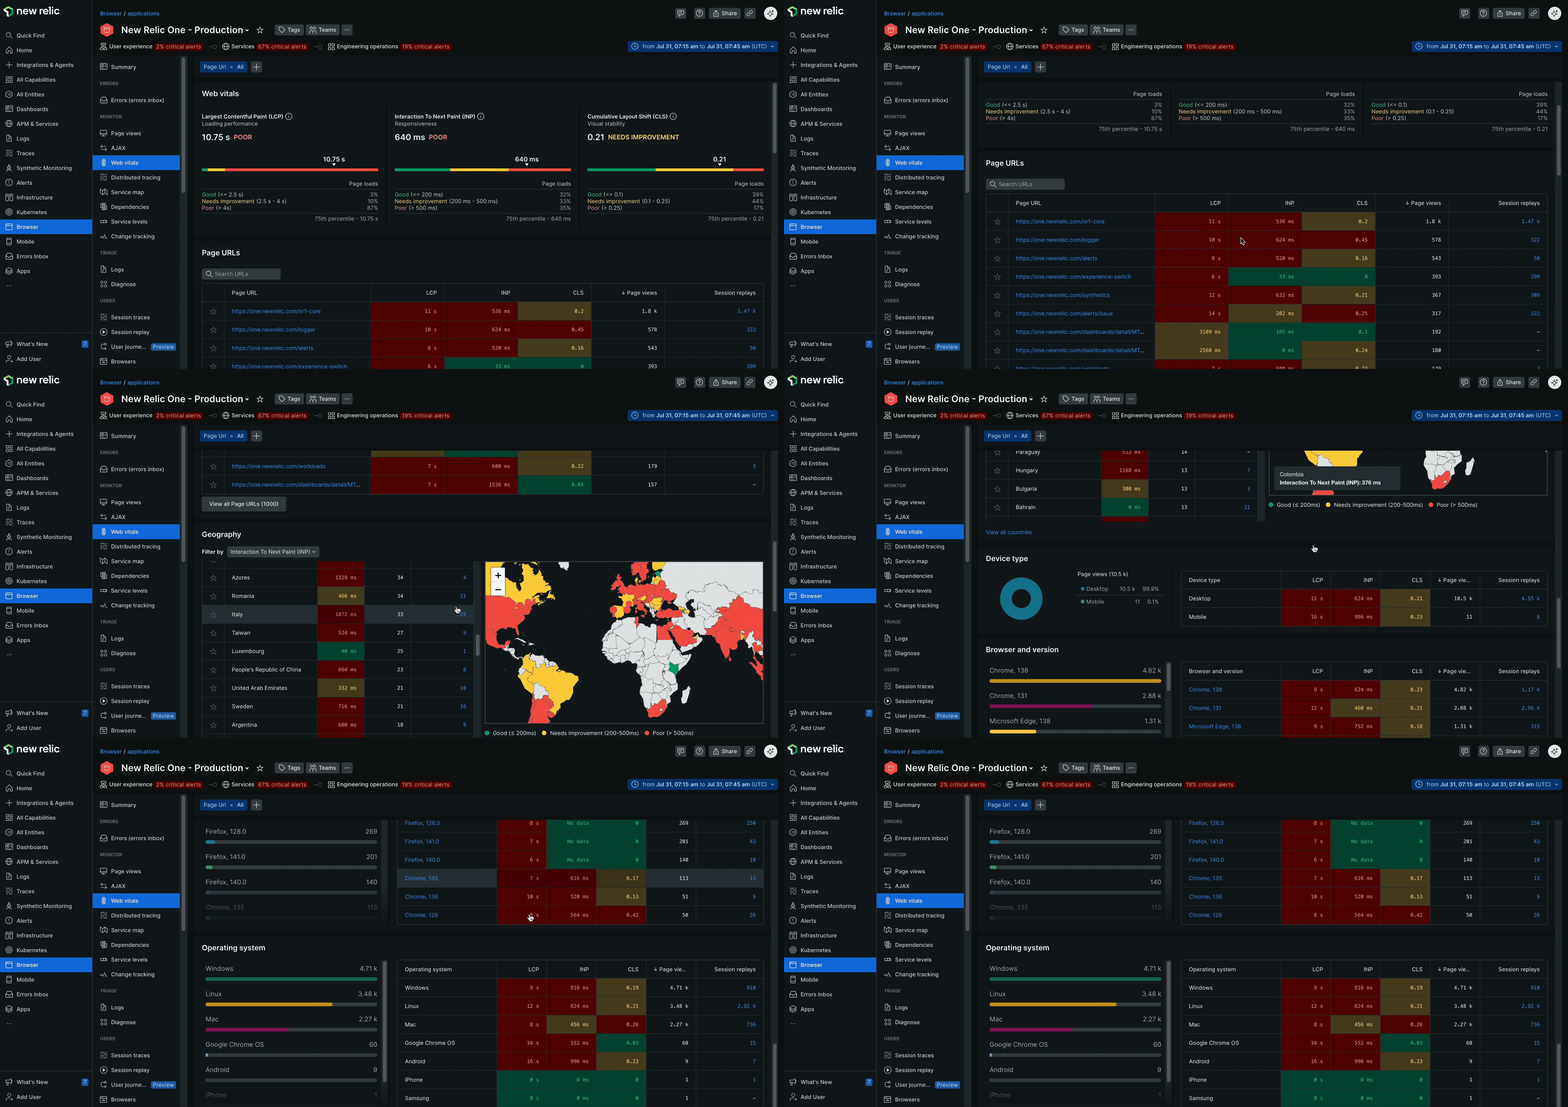
The Web vitals page shows your web vital averages for your whole website. From this view, you can drill down into specific pages or metrics to see what's impacting the scores.

Drill down into specific pages
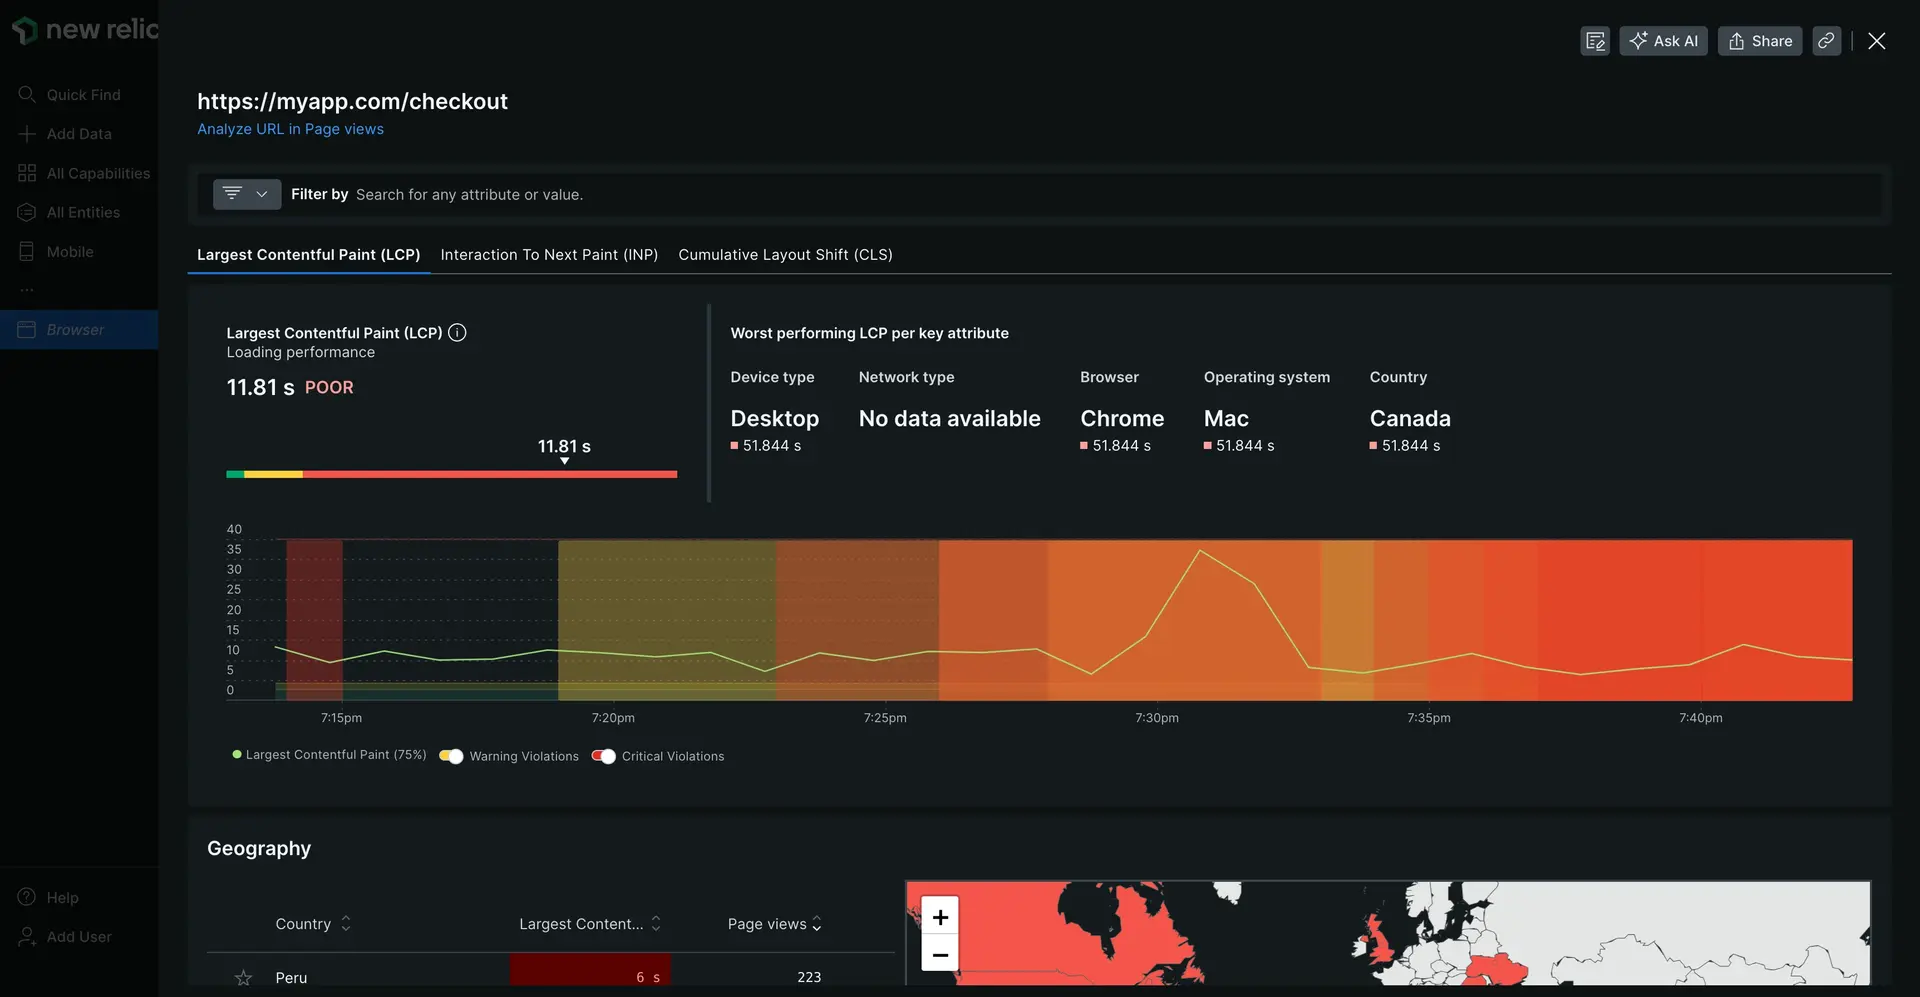
If you want insight into an important page — for example, an ecommerce checkout page — find it in the Page URL table. You'll see a breakdown of what's contributing to CWVs, which you can use to understand how your end users are experiencing those areas of your site. For example, if you notice a pattern of poor performance from Chrome browsers, you can curate any future improvements to that user base.

one.newrelic.com > All capabilities > Browser > (select an app) > Monitor > Web vitals > (click a page URL): View a breakdown of CWVs for the most impactful webpages.
Filter by key attributes
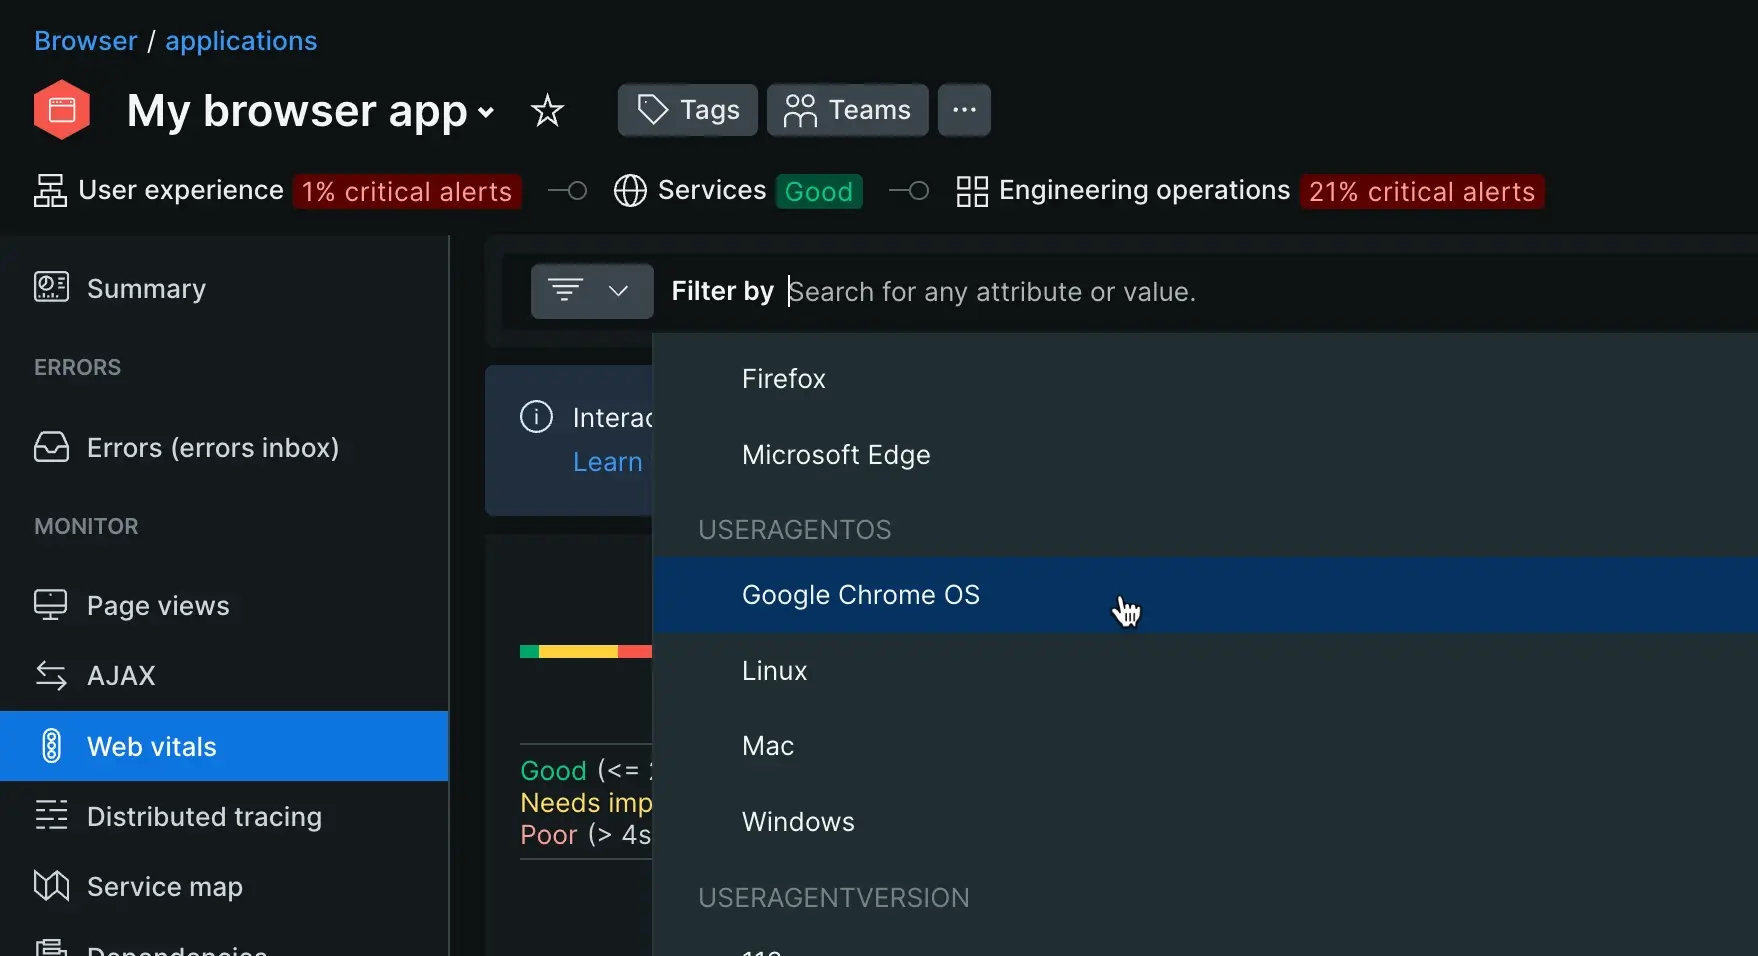
If you want to investigate something particular, like how a backend change or performance issue impacted CWVs, you can use the Filter by tool to filter any key attribute.

one.newrelic.com > All capabilities > Browser > (select an app) > Monitor > Web vitals > (add filters): Use the filter tool to filter core web vitals by key attributes.
Though you can filter by nearly any key attribute, read on for some useful examples.
Get more context with session traces
New Relic captures data about a user's session on a given page. Session traces are randomly sampled, letting you view how a user experienced page load timing issues, JavaScript events, or other errors.

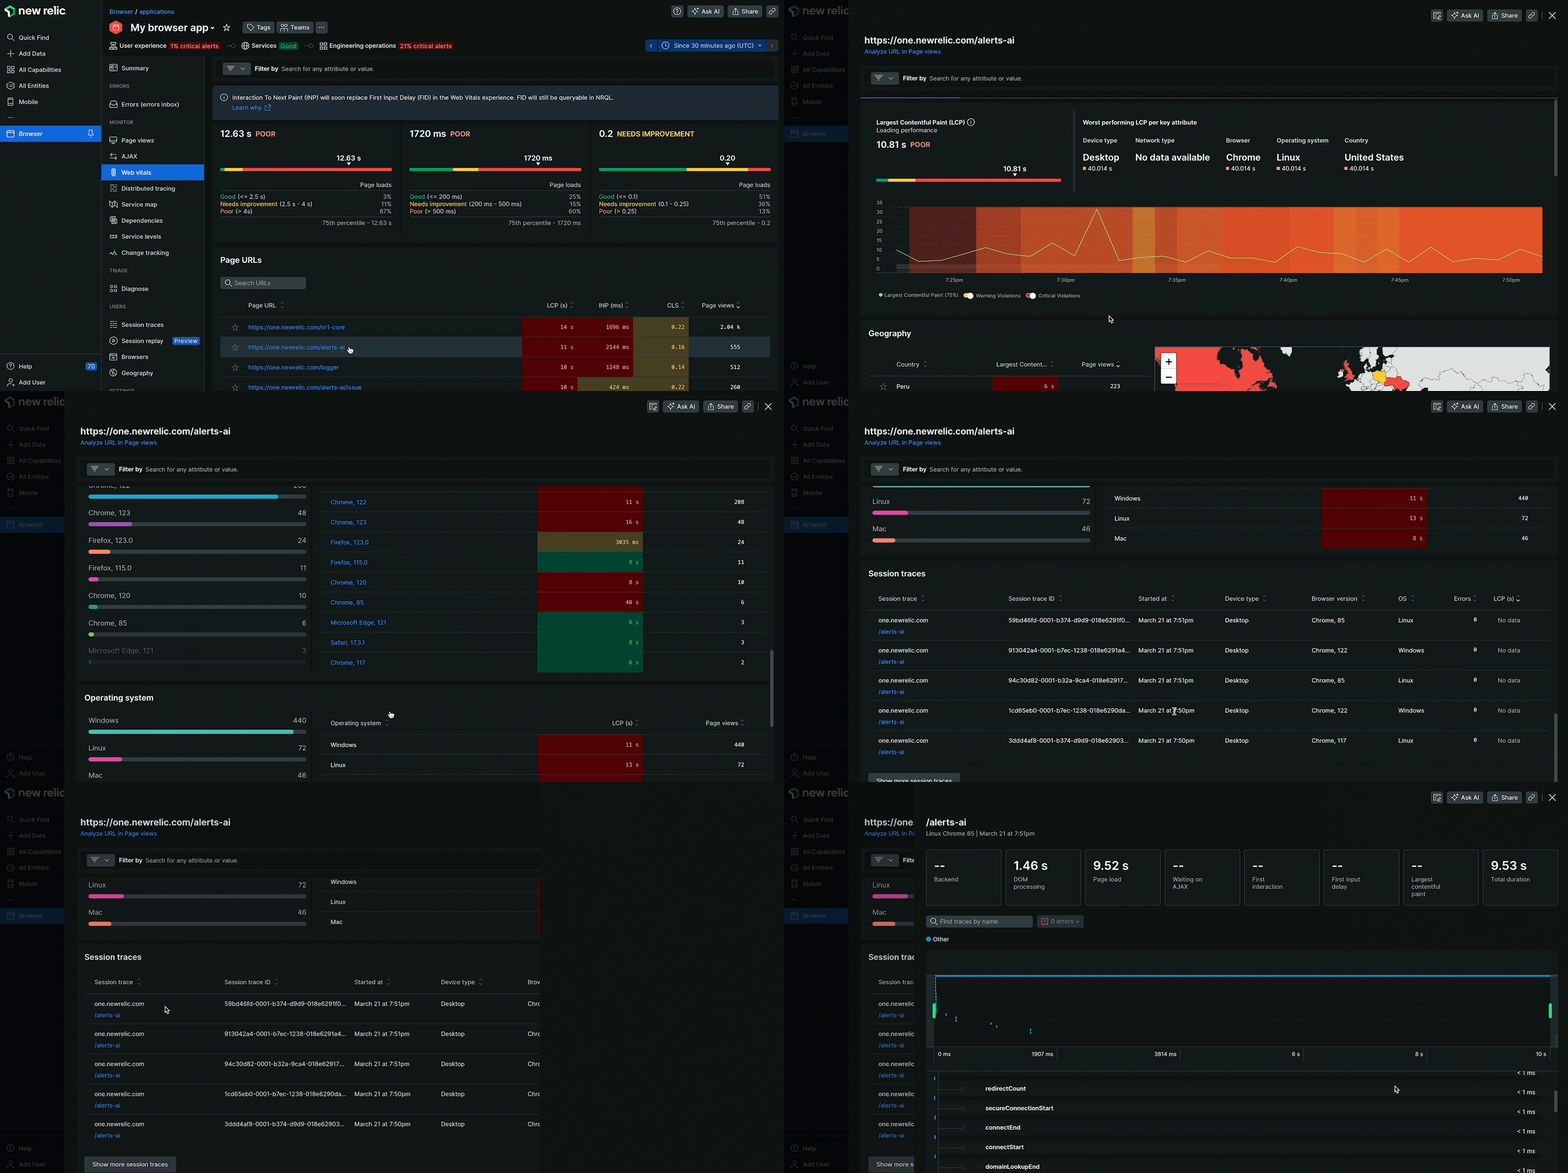
We recommend using session traces to find patterns across different user sessions. If one of your CWVs scores could be improved, one option is to look at session traces to see what common attributes are shared across different user sessions. Here's an example of how session traces can help you improve your site:
- From the Web vitals tab, click the page that's performing poorly. Using the above image as an example, you see that your site has a good overall LCP score, but you also notice some of your individual pages need improvement.
- Looking at the Page URLs section of the Web vitals page, you see that your homepage URL has an LCP score of greater than four seconds. Is this due to an error that affects all users, or is it only affecting one kind of user? For example, if you notice that users with one version of Chrome or a certain operating system are experiencing slow page load times, you can better troubleshoot the specific cause of an issue.
- A new window will populate when you click the URL you want to troubleshoot. You notice that your LCP score is much higher than your site's overall LCP score. Scrolling to the Session traces section at the bottom of this page, you see various samples of real user sessions. These sessions can give you more granular detail about how that user experienced AJAX requests, issues related to DOM loading, JavaScript events or other errors.
Data from randomized sessions helps you find patterns across hundreds or thousands of user interactions with a web page. If a pattern appears in this randomly selected data, you can have more confidence that your plan to resolve an issue will improve your page scores.
Enhance your understanding with session replays
If a poor LCP or a high CLS has been identified, session replays provide a visual record of what occurred, helping to quickly pinpoint the exact element or event causing the problem.
Here's an example of how session replays can help you improve your site:
- Identify a performance issue: On the Web vitals page, click the relevant URL to open its detailed performance view. This action redirects to a detailed view of the web vitals information for that page. Examine the CWV scores and look for any with the Needs improvement or Poor labels. You can also filter the results by device type or browser, as performance issues can vary significantly across platforms. Understanding these details helps pinpoint specific areas for optimization.
- Access relevant replays: Click the number in the Session replays column for the data point you're investigating. This action automatically filters the replays to display sessions that experienced the specific performance issue. For example, clicking on the session replay count for a page with a poor LCP will present a list of sessions where the LCP was slow.
- Watch and diagnose: Watch the video recordings to gain a visual understanding of the problem. You might discover:
- LCP issues: A large hero image or video that loaded slowly, causing a blank screen for several seconds.
- CLS issues: An advertisement or third-party content that loaded late, causing the page content to unexpectedly shift.
- INP issues: A slow-responding button or interactive element can cause frustration.
By combining the technical data from session traces with the visual context of session replays, you can develop a comprehensive plan to resolve performance issues and significantly enhance your end-user experience.